Pulse Dashboard is a revolutionary Next.js component and standalone CLI tool designed to provide real-time monitoring and historical analysis of Playwright test executions. It empowers development and QA teams to quickly identify issues, track test performance over time, and gain deep insights into failure patterns.
Watch your tests execute in real-time with live updates and instant feedback on test results.
Track performance trends and identify patterns across multiple test runs with rich visualizations.
Advanced failure categorization and AI-powered suggestions to resolve issues faster.
It can be: Run as a Standalone CLI Tool: Install
globally or use with npx
to quickly view reports.
[Note: Pulse Dashboard uses playwright-pulse-report generated data]
Getting started with Pulse is simple. You can install it as an npm package and run it with a single command.
Use npm package manager to add Pulse to your project.
npm install pulse-dashboard@latest
After installation, start the dashboard using the following npx command from your project's root directory.
npx start-dashboard
The dashboard provides a high-level, real-time overview of your latest test run. It is the central hub for at-a-glance information about your test suite's health and performance metrics.
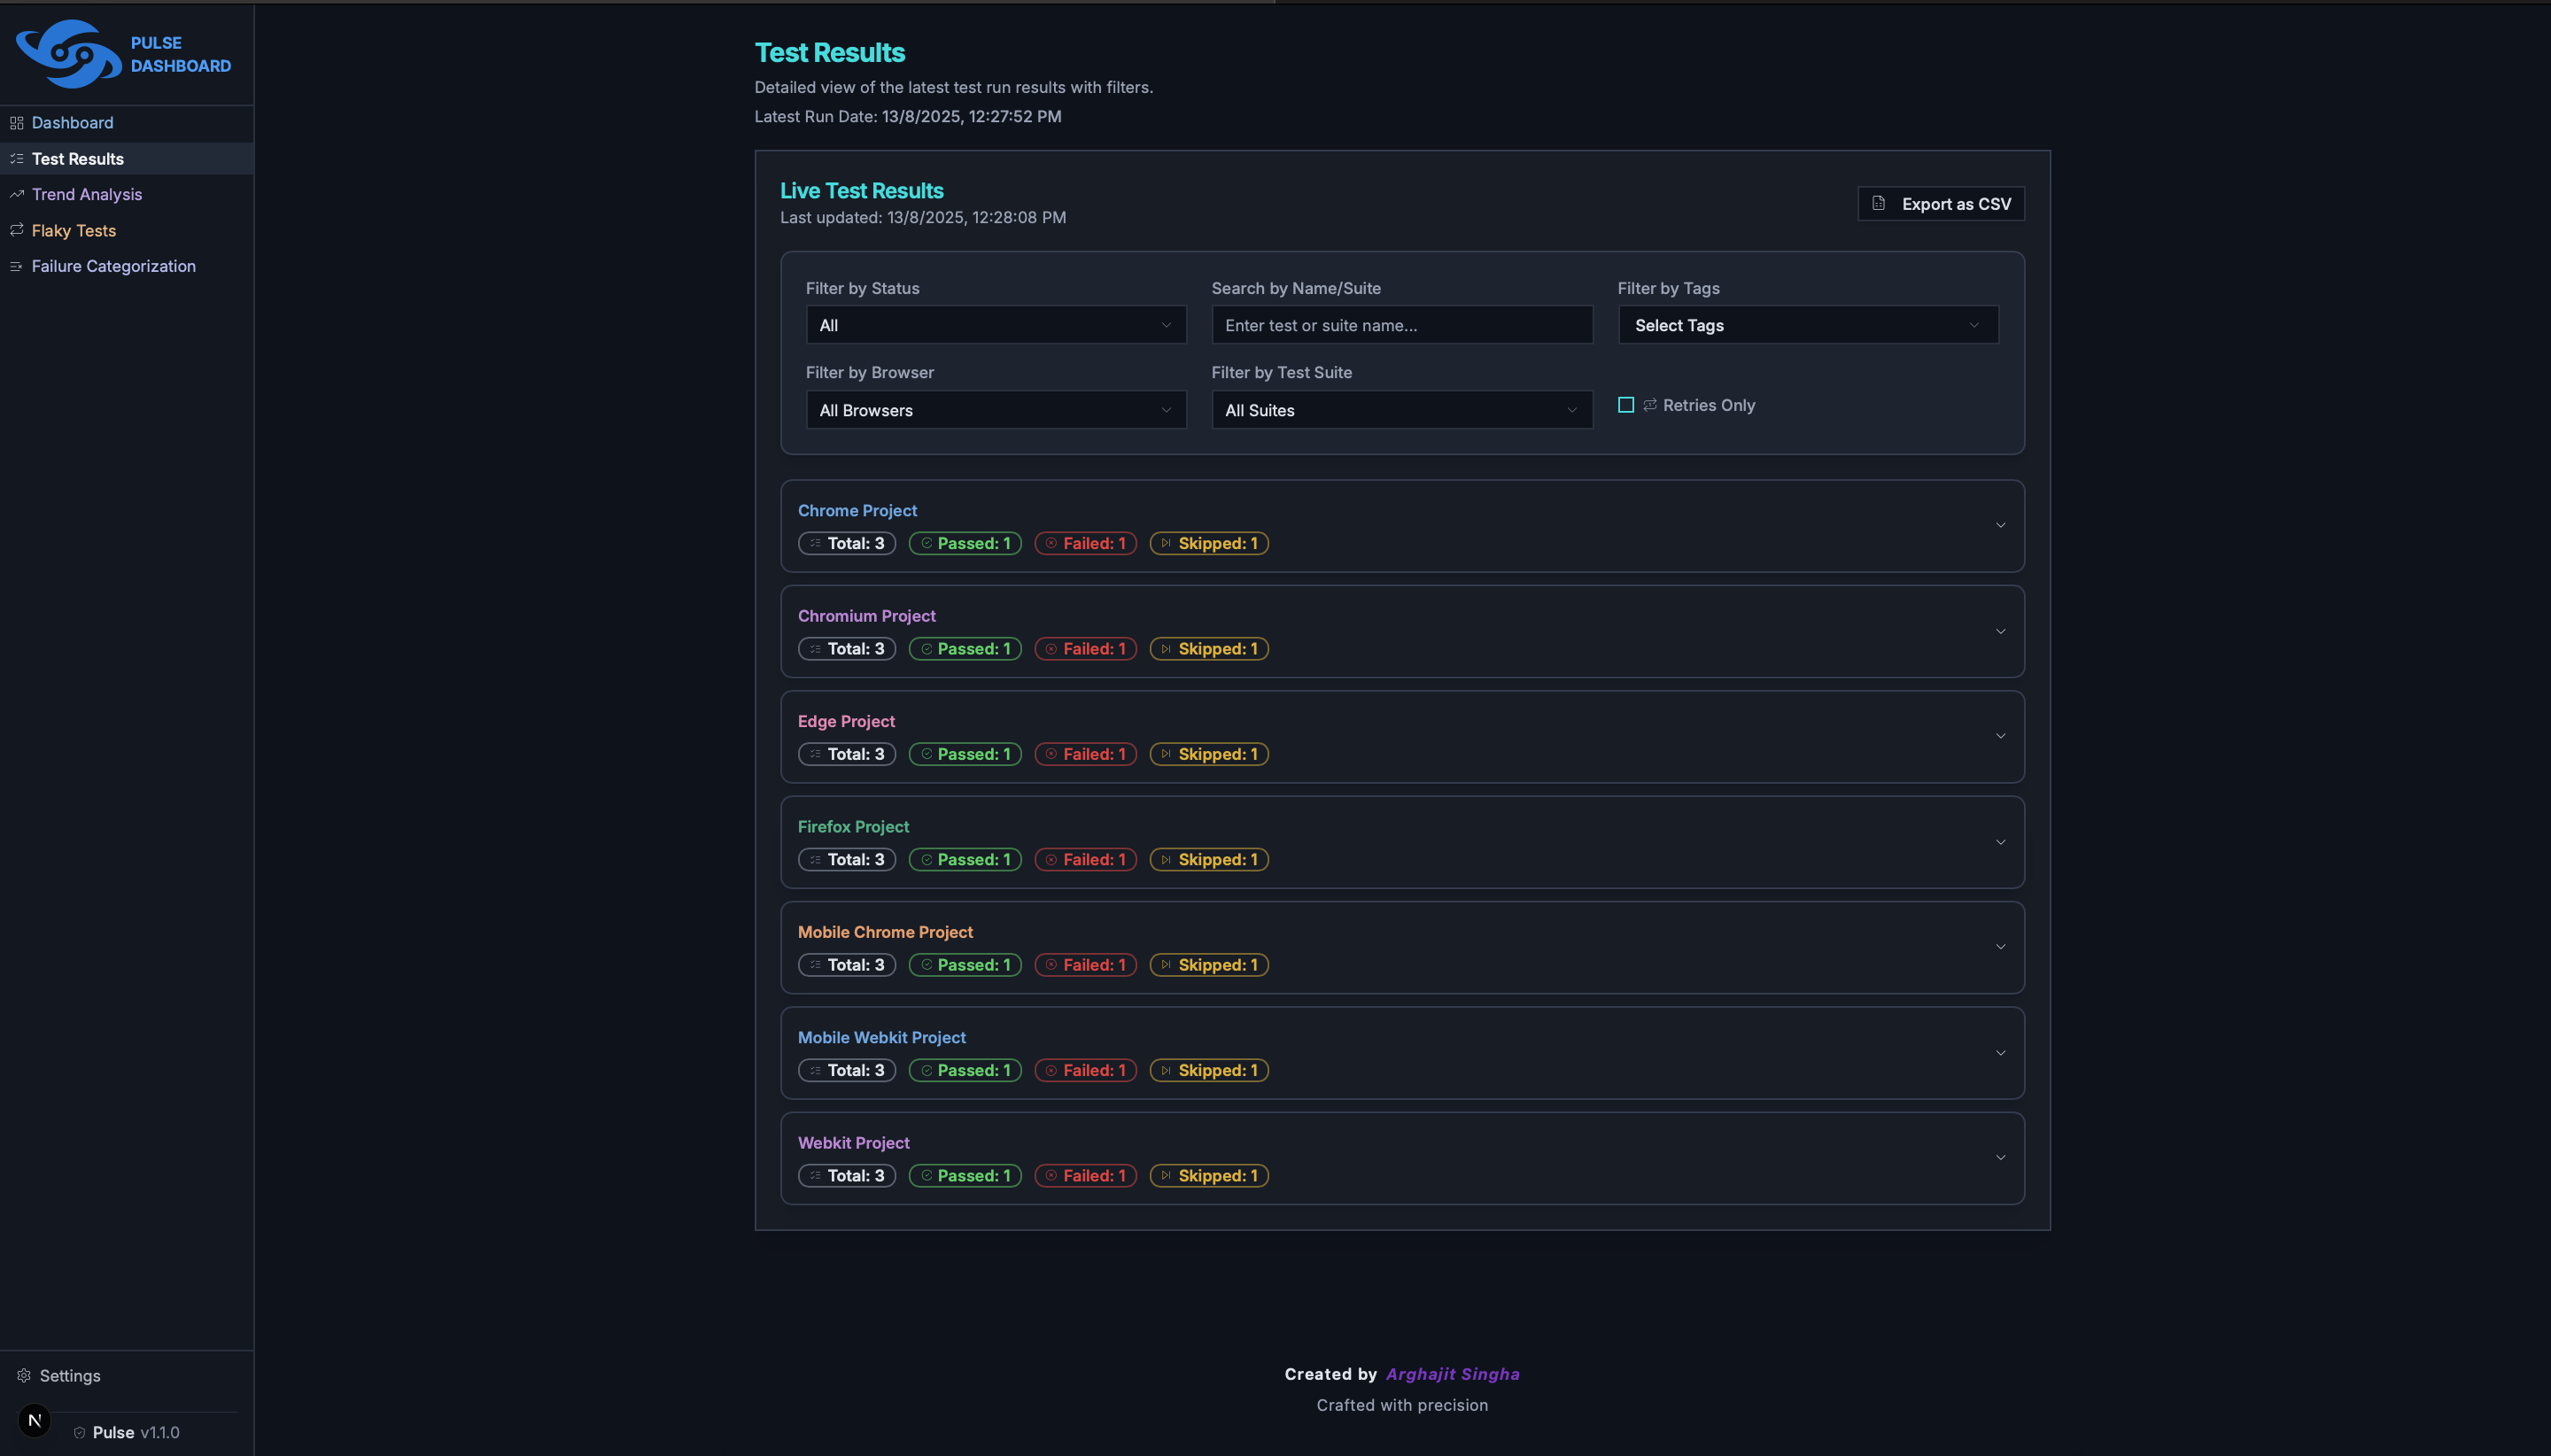
👉🏼 The Test Results page allows users to browse and filter the outcomes of the latest test run. You can expand each suite to see the individual tests within it.
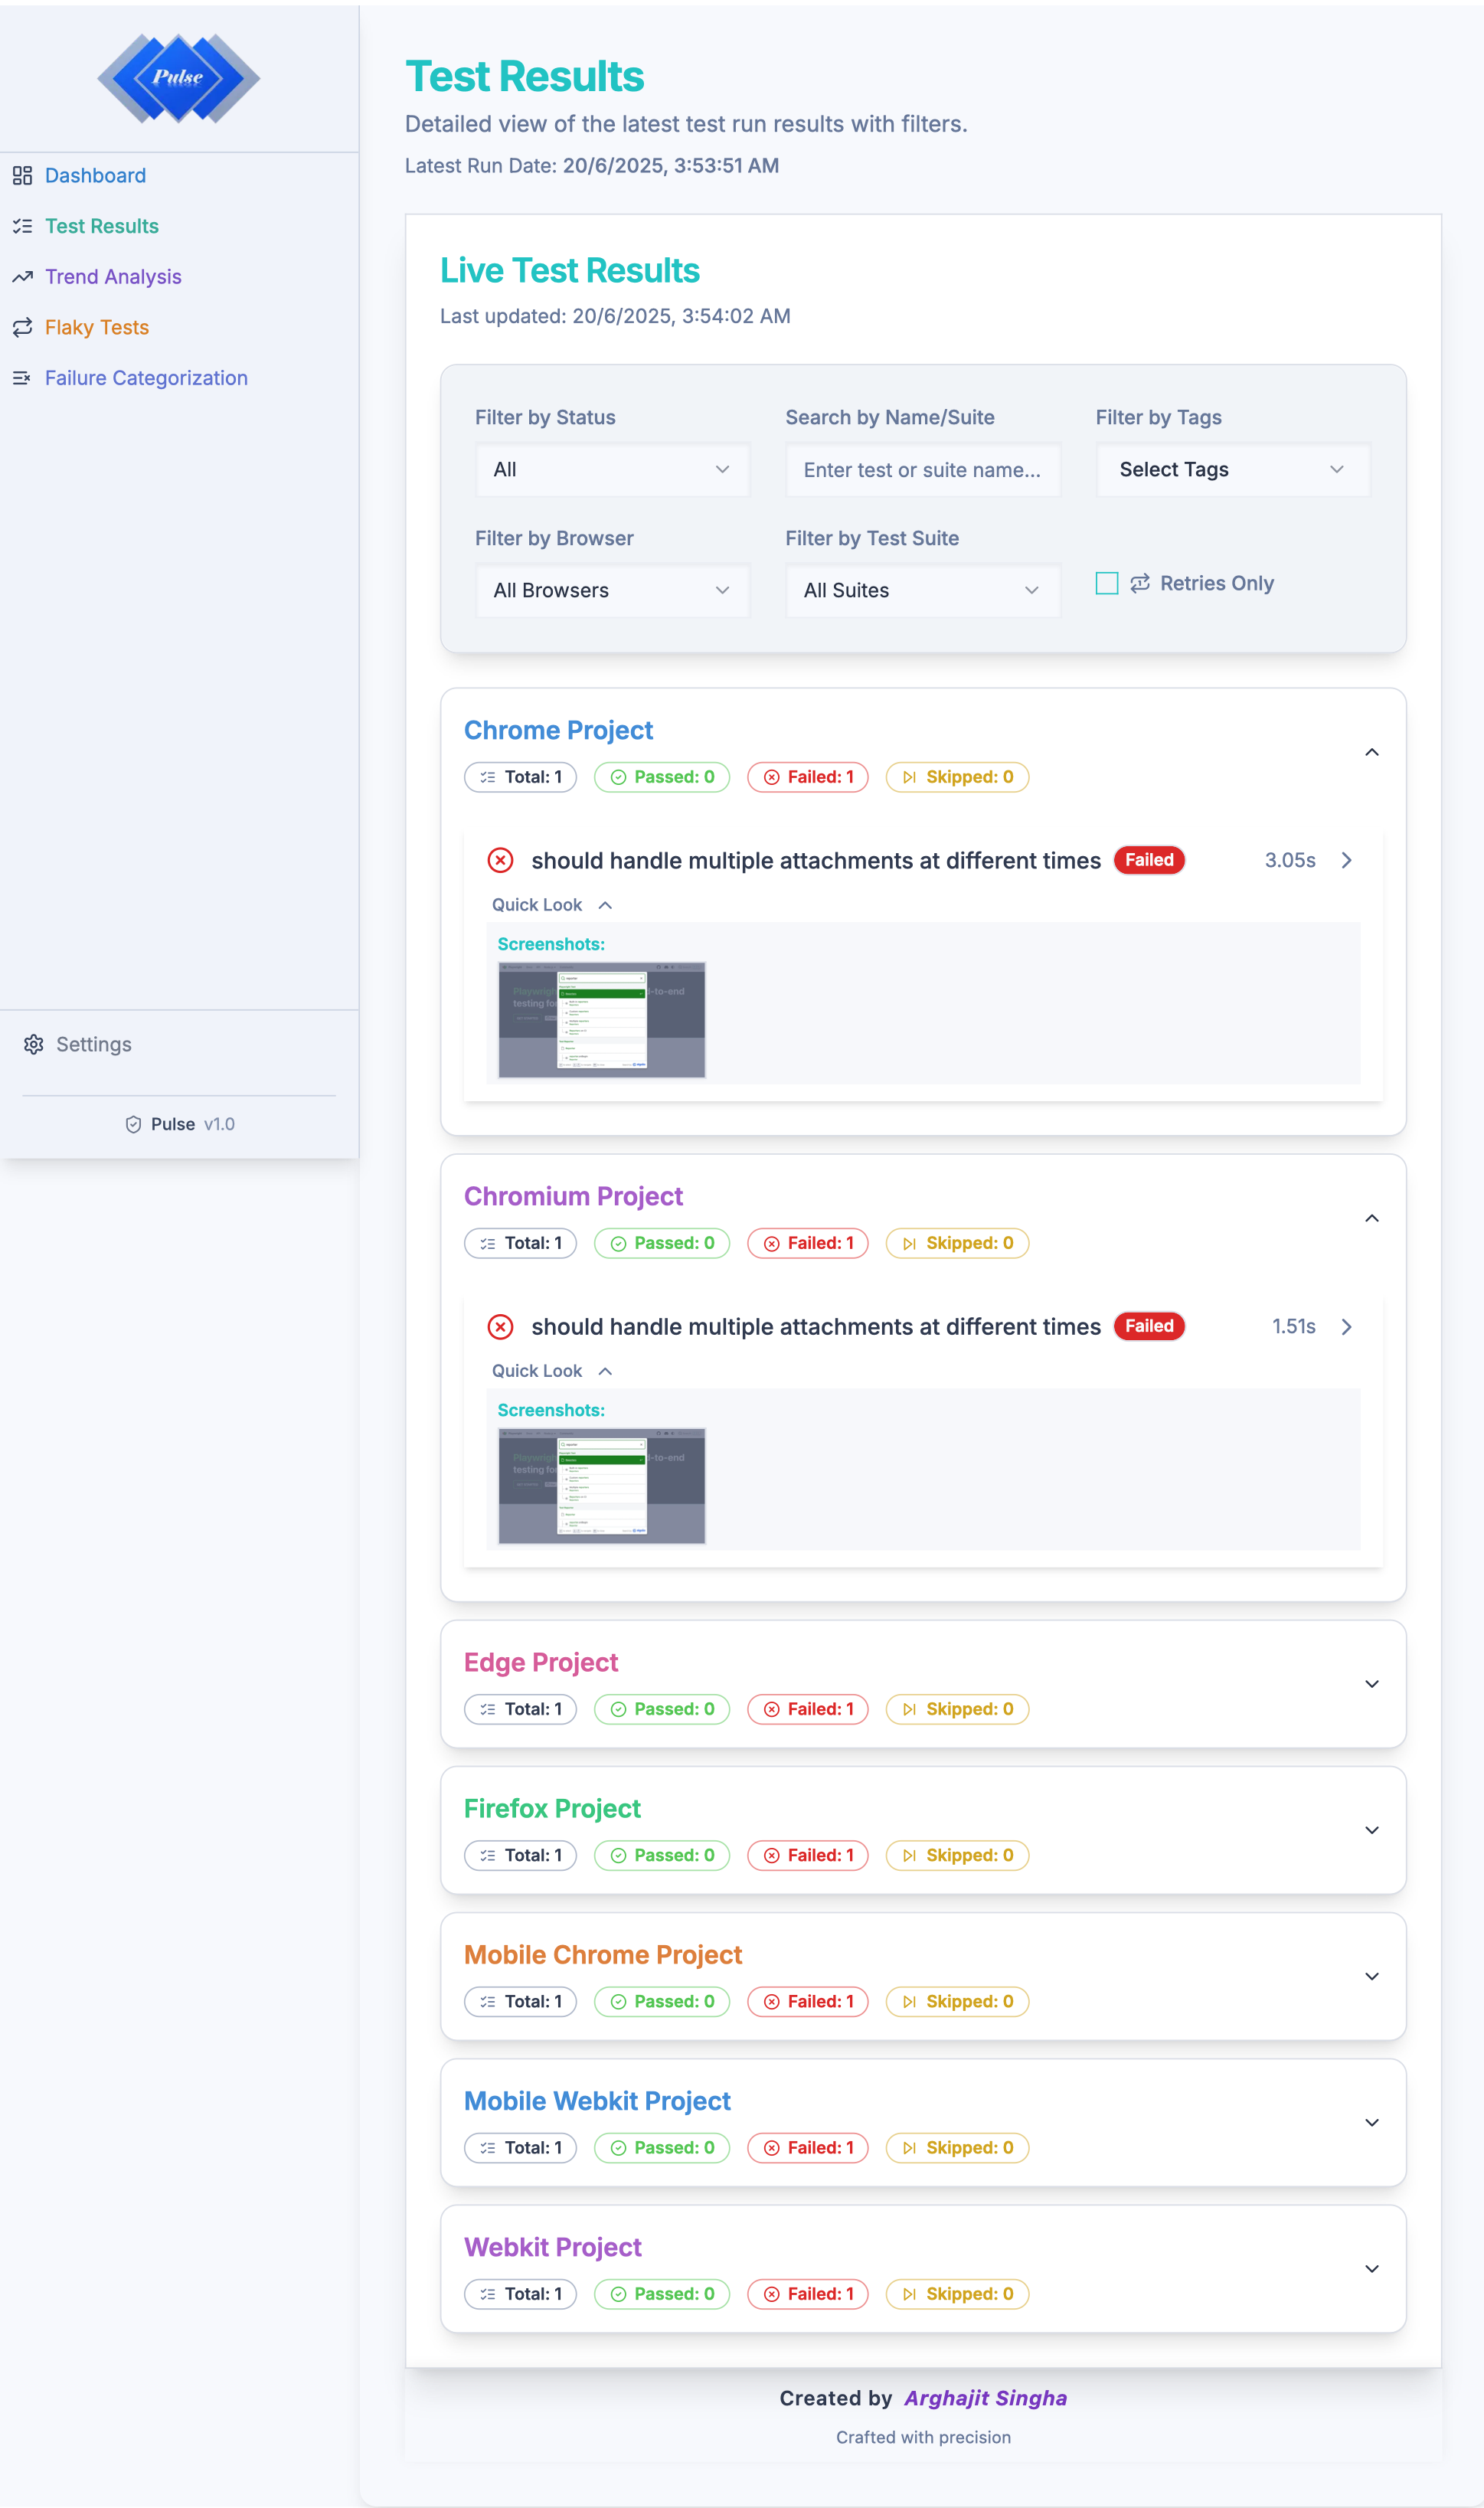
👉🏼 Expanded Test Results provides users a quick look at the failed test cases, including properly formatted test error logs and attached failure screenshots.
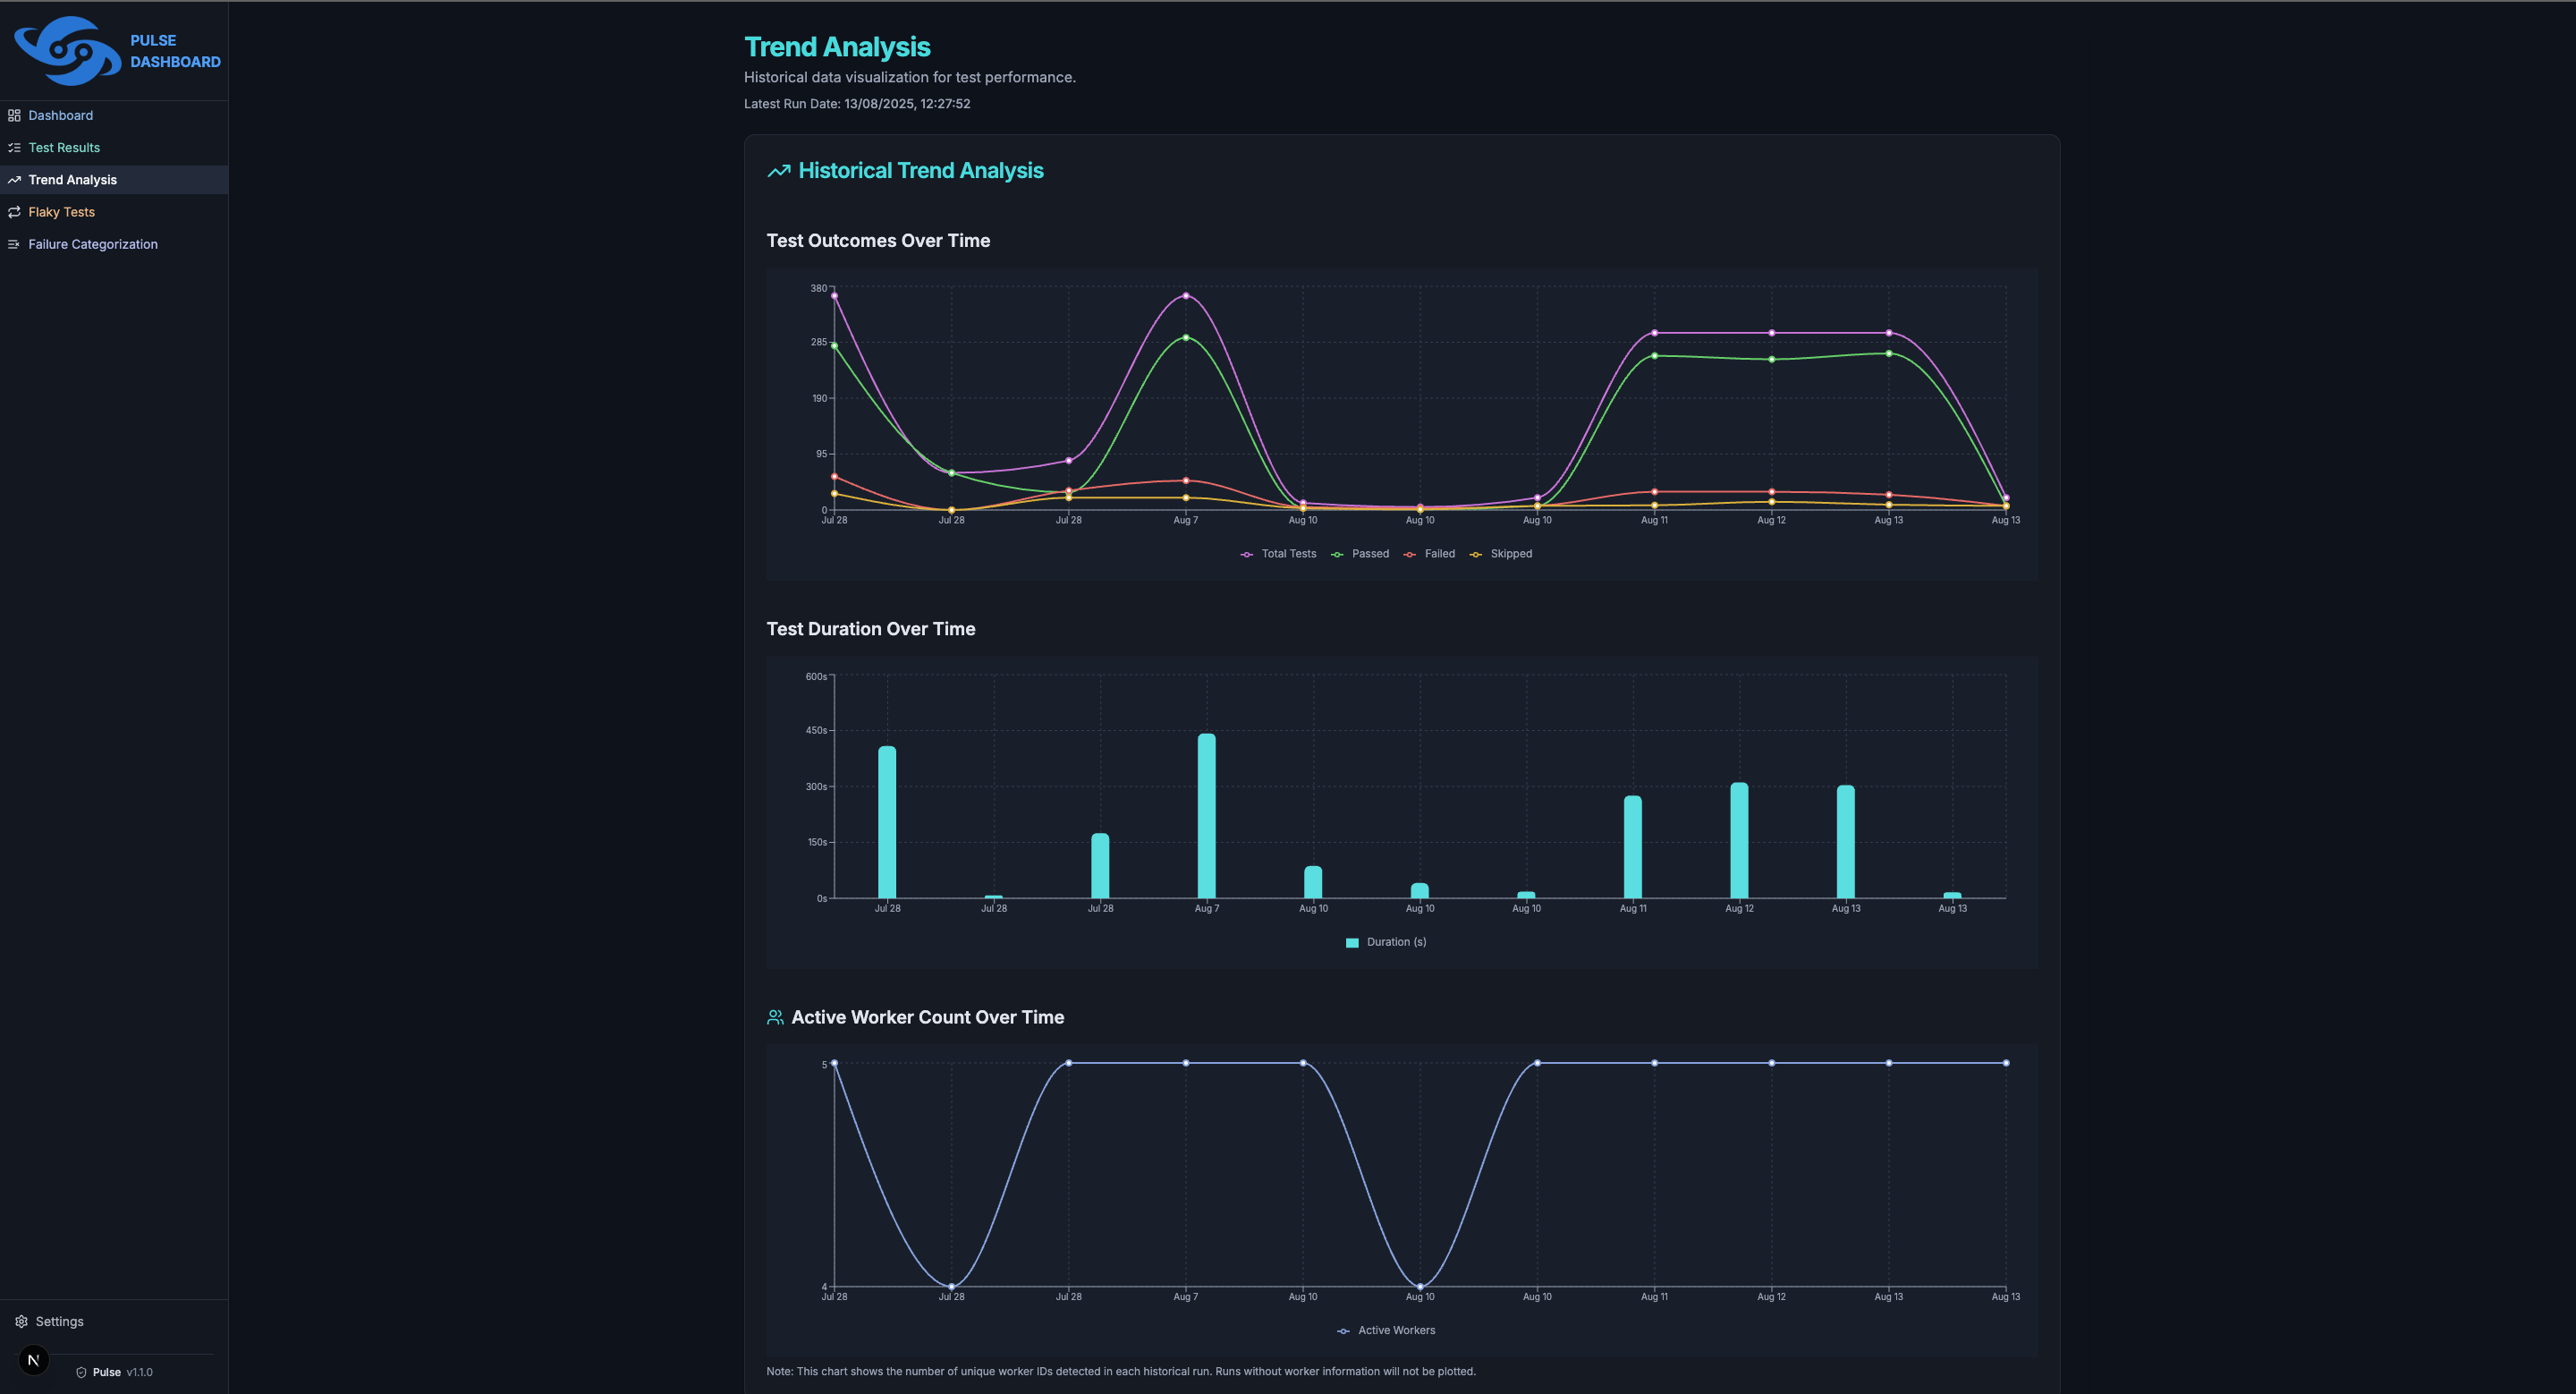
This page provides historical data visualization, allowing you to track test performance and stability over time with advanced analytics.
👉🏼 Test Outcomes Over Time: This chart provides detailed analysis of the test suite runs, for current & existing historical run trends, in chronological order.
👉🏼 Test Duration Over Time: This chart provides total duration of the test suite runs, for current & existing historical run trends, in chronological order.
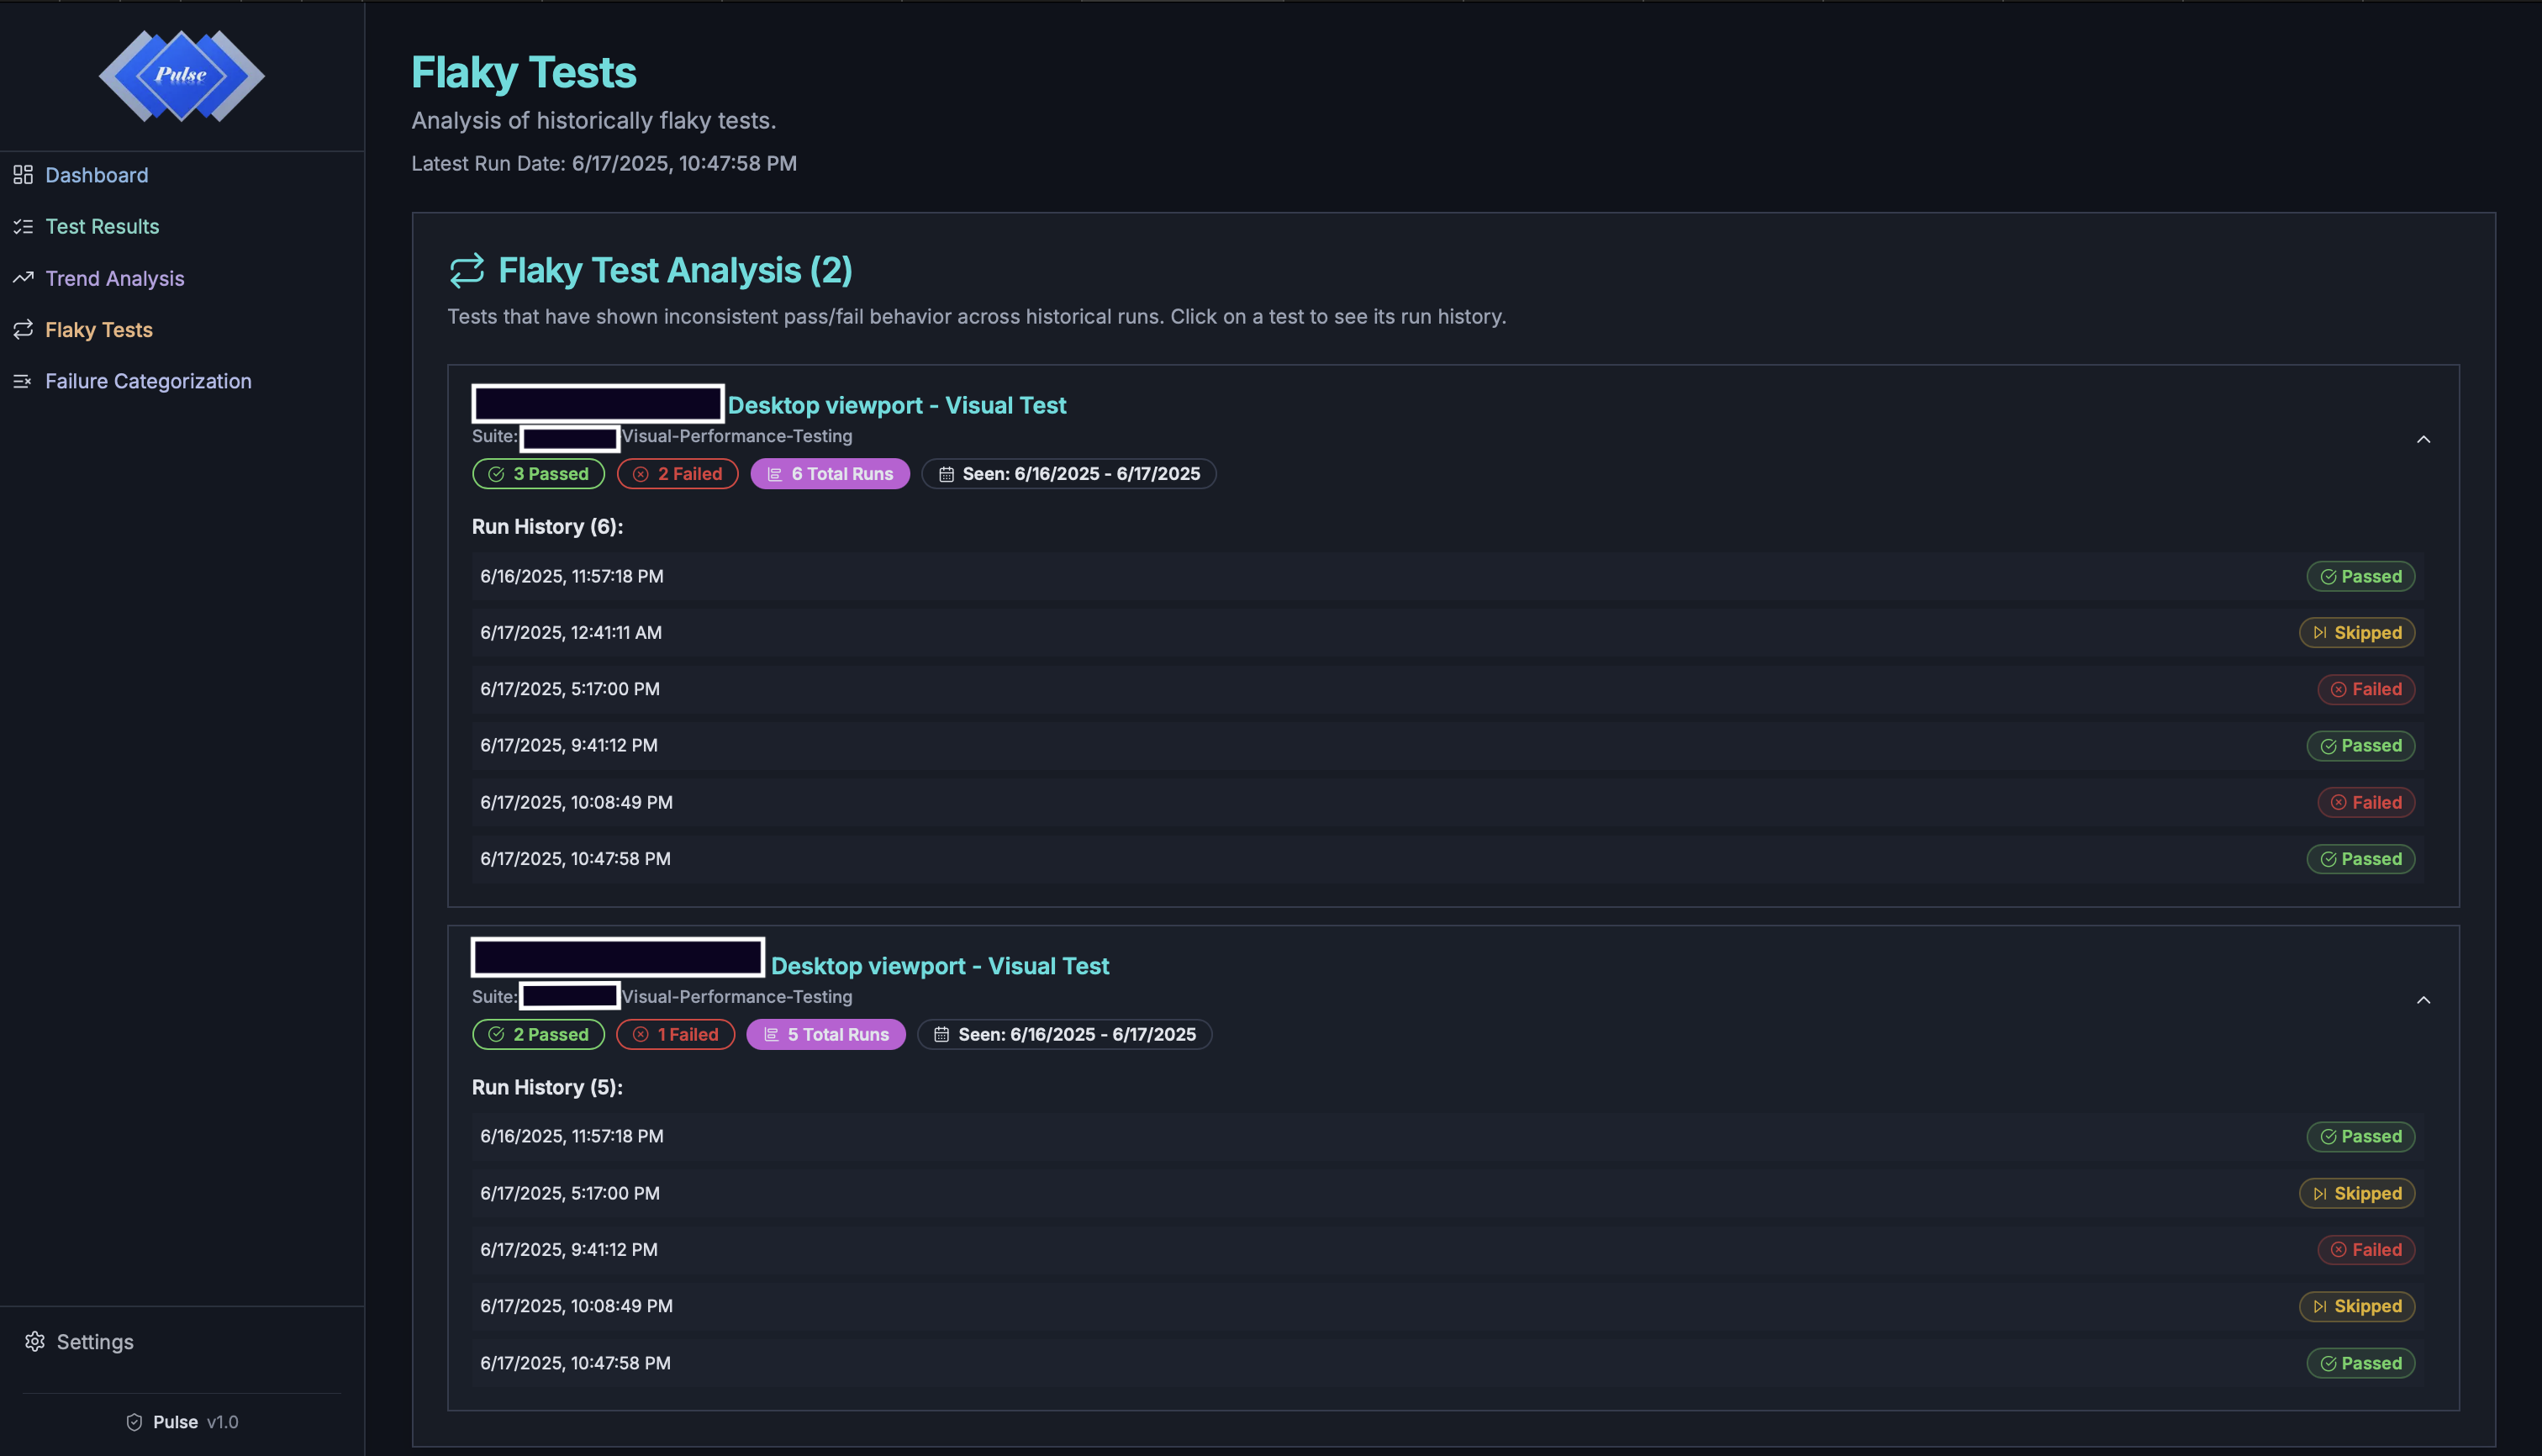
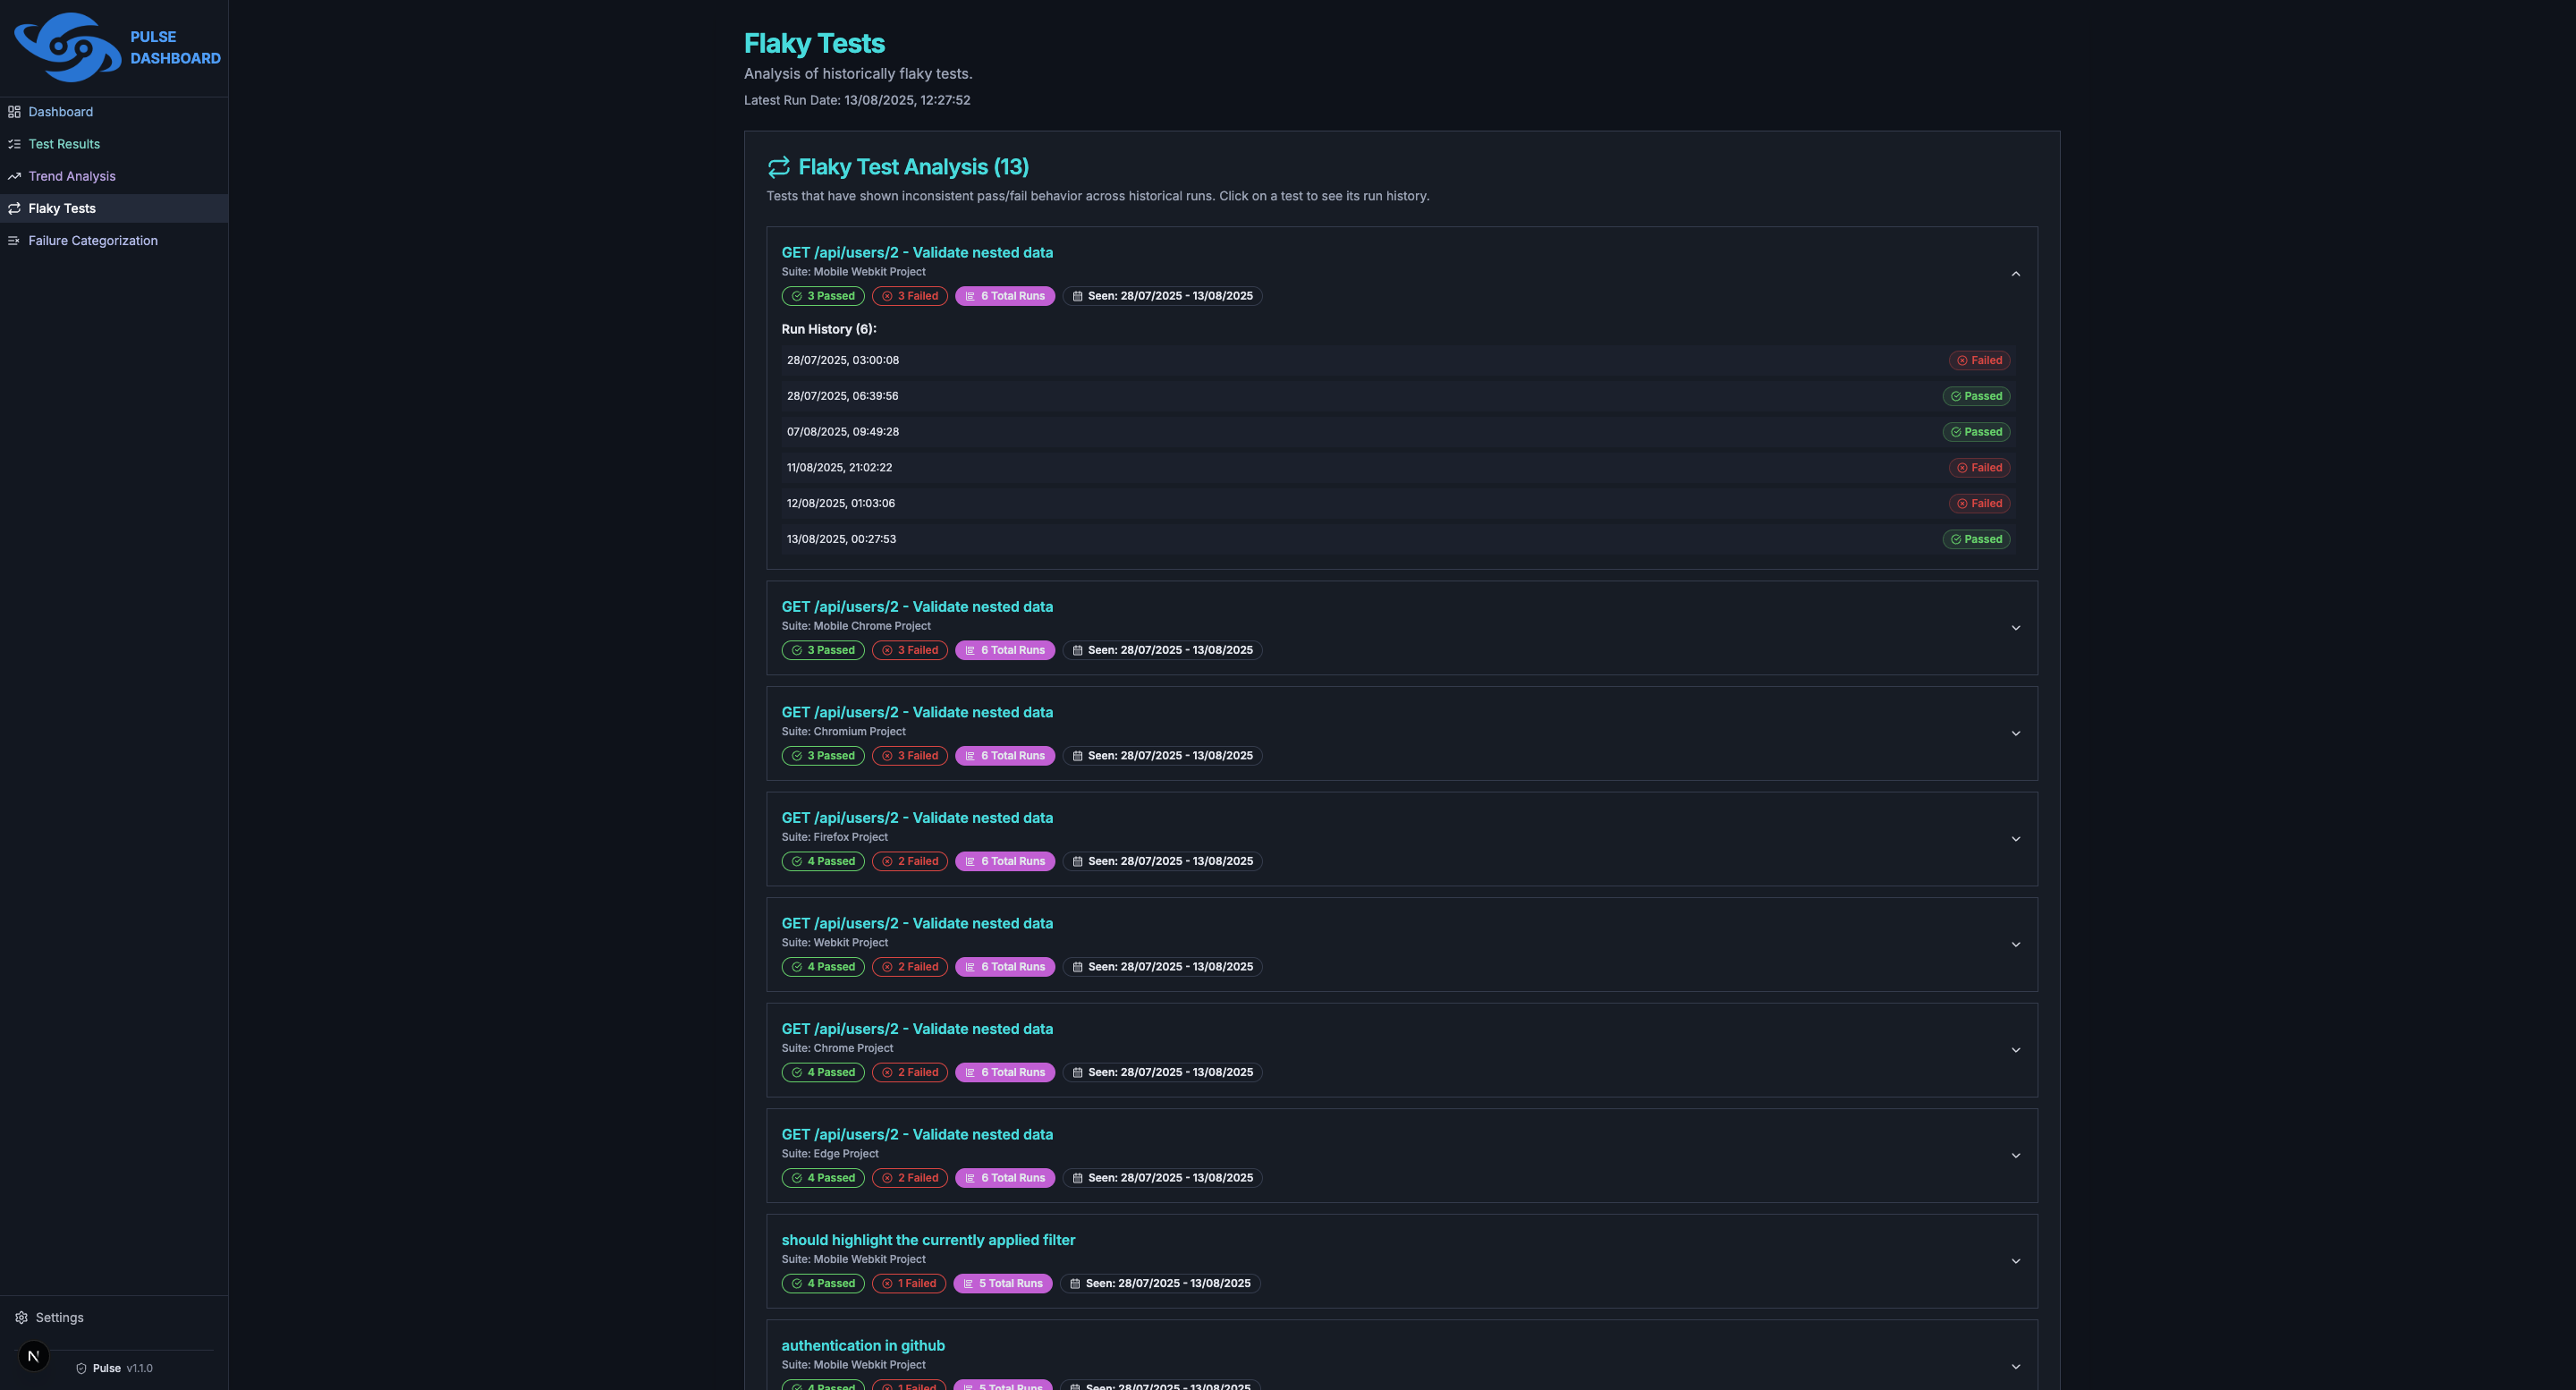
Flaky tests are tests that exhibit inconsistent behavior. This page helps you identify and analyze them by showing their historical pass/fail rates with intelligent pattern recognition.
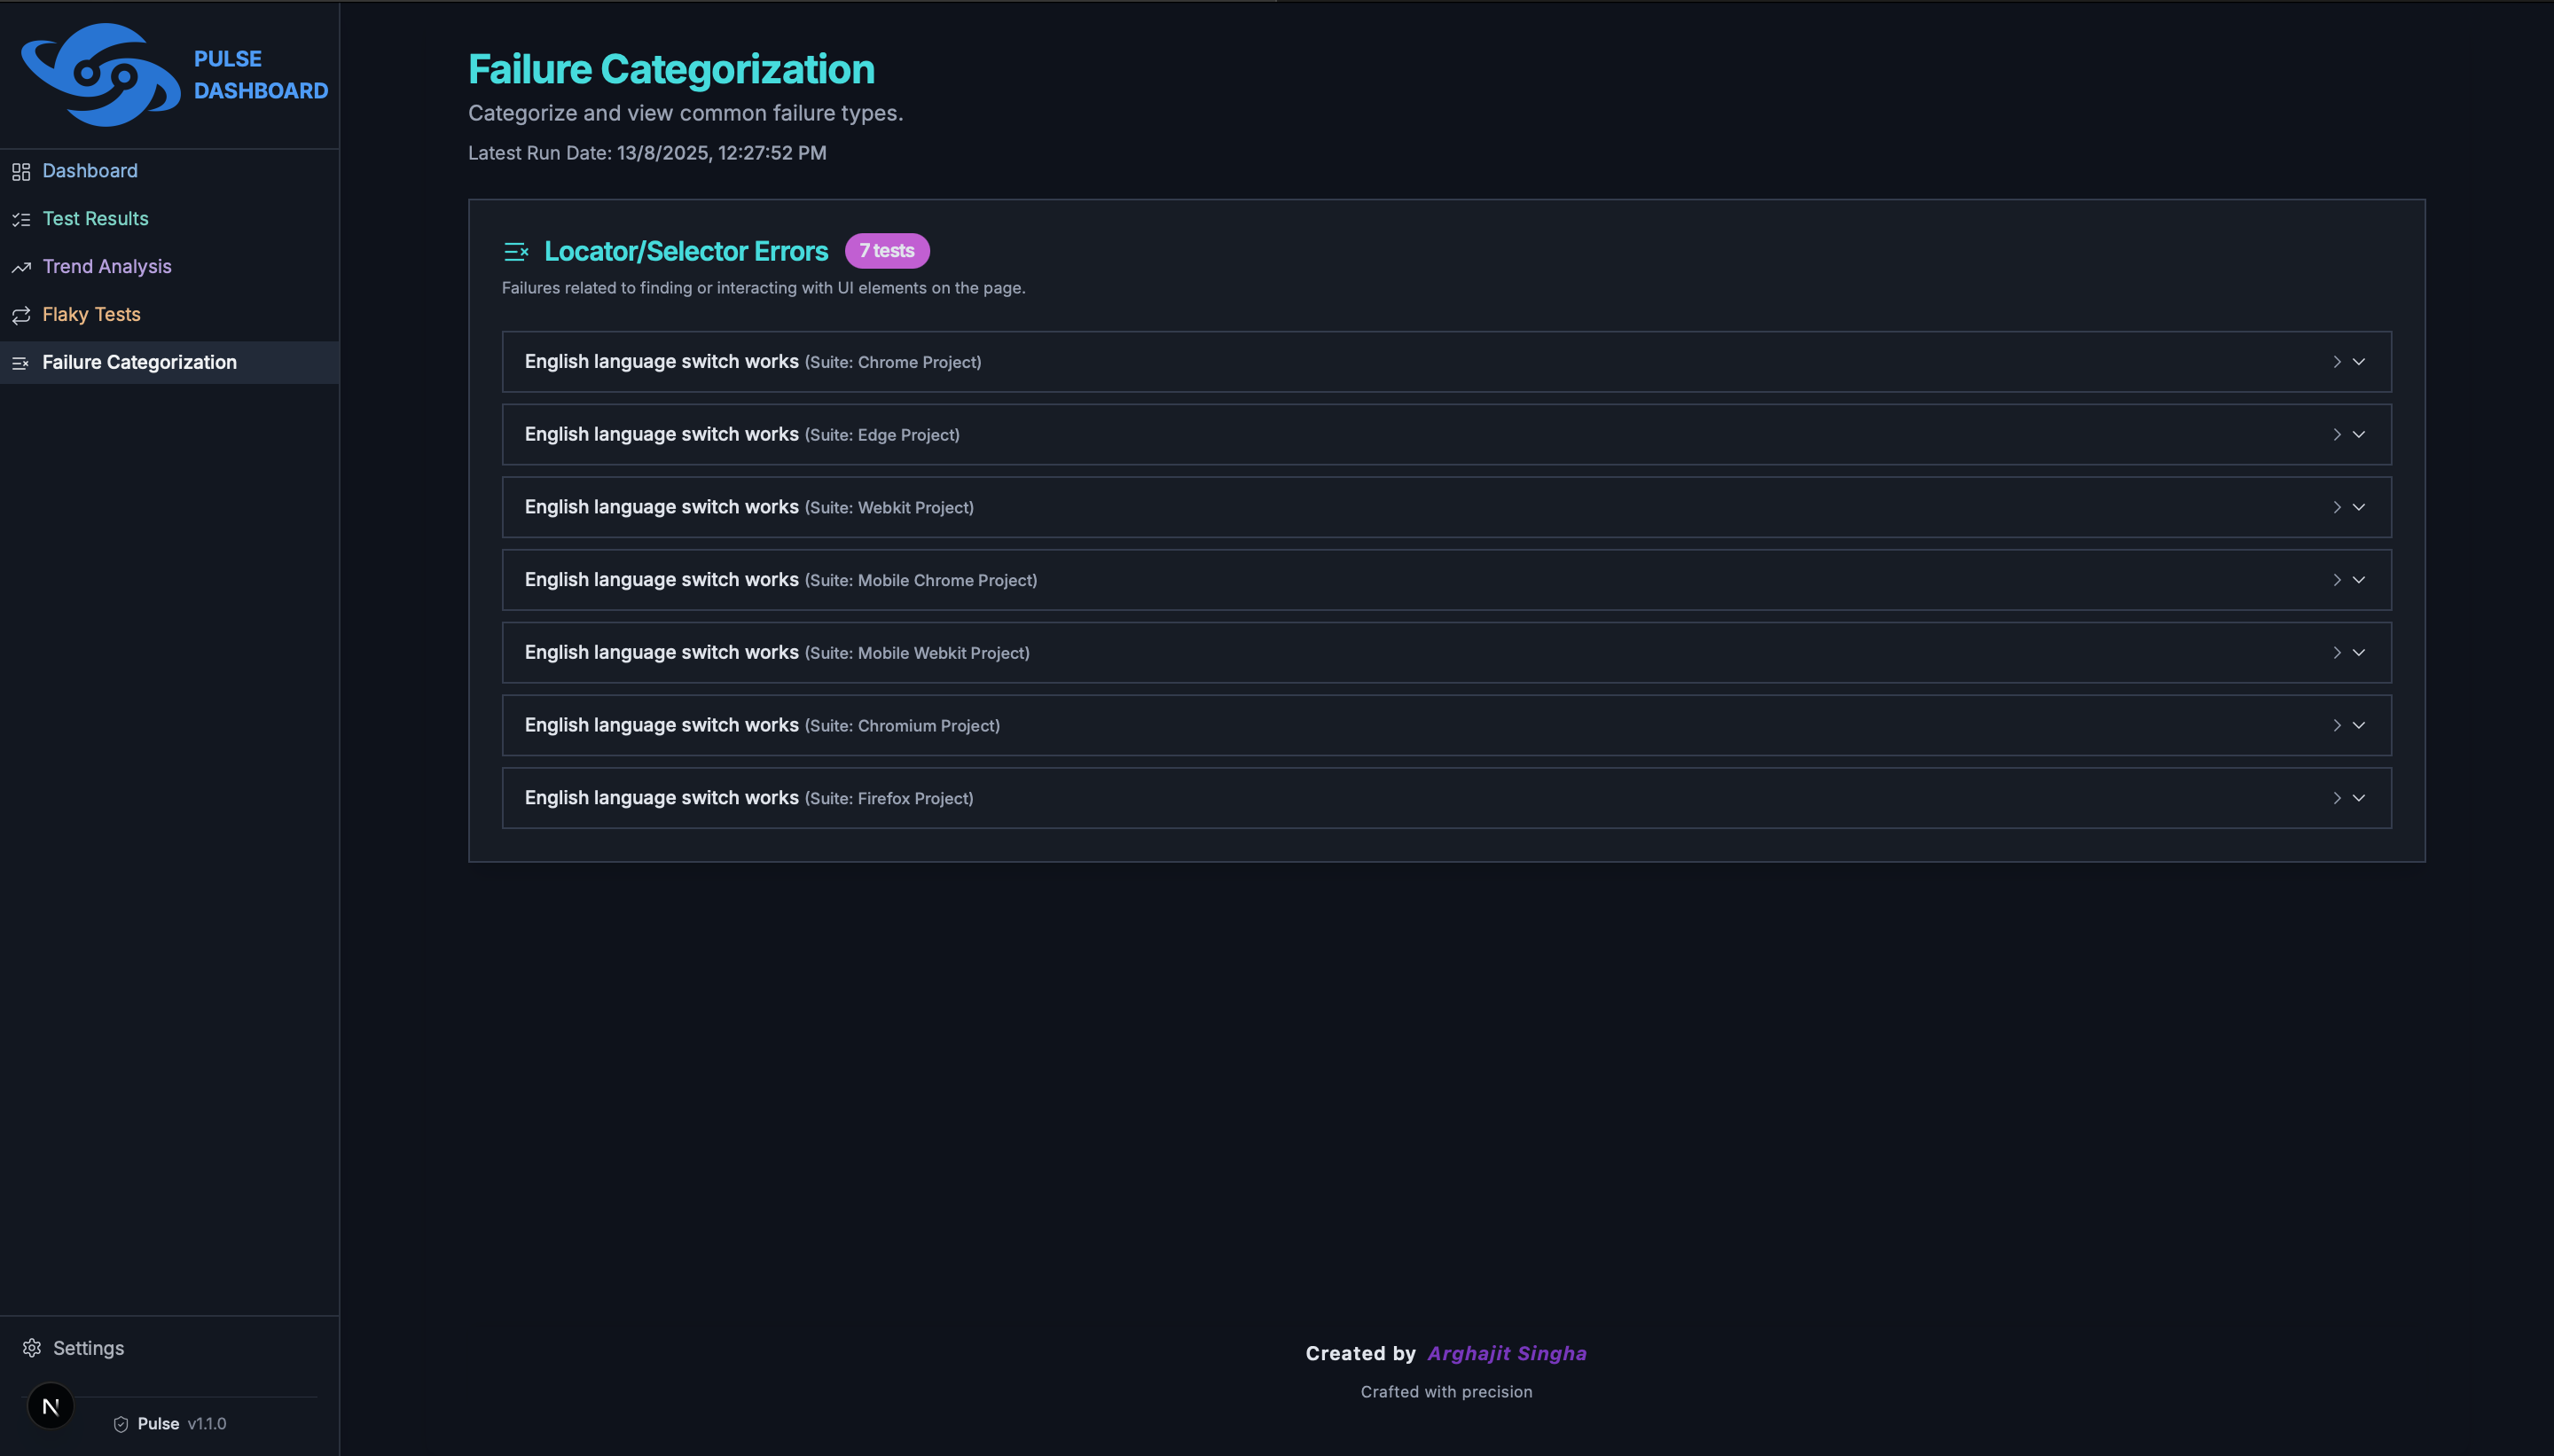
This powerful feature automatically groups failed tests by the common type of error that occurred, helping you quickly identify the most common root causes of failures with AI-powered analysis.
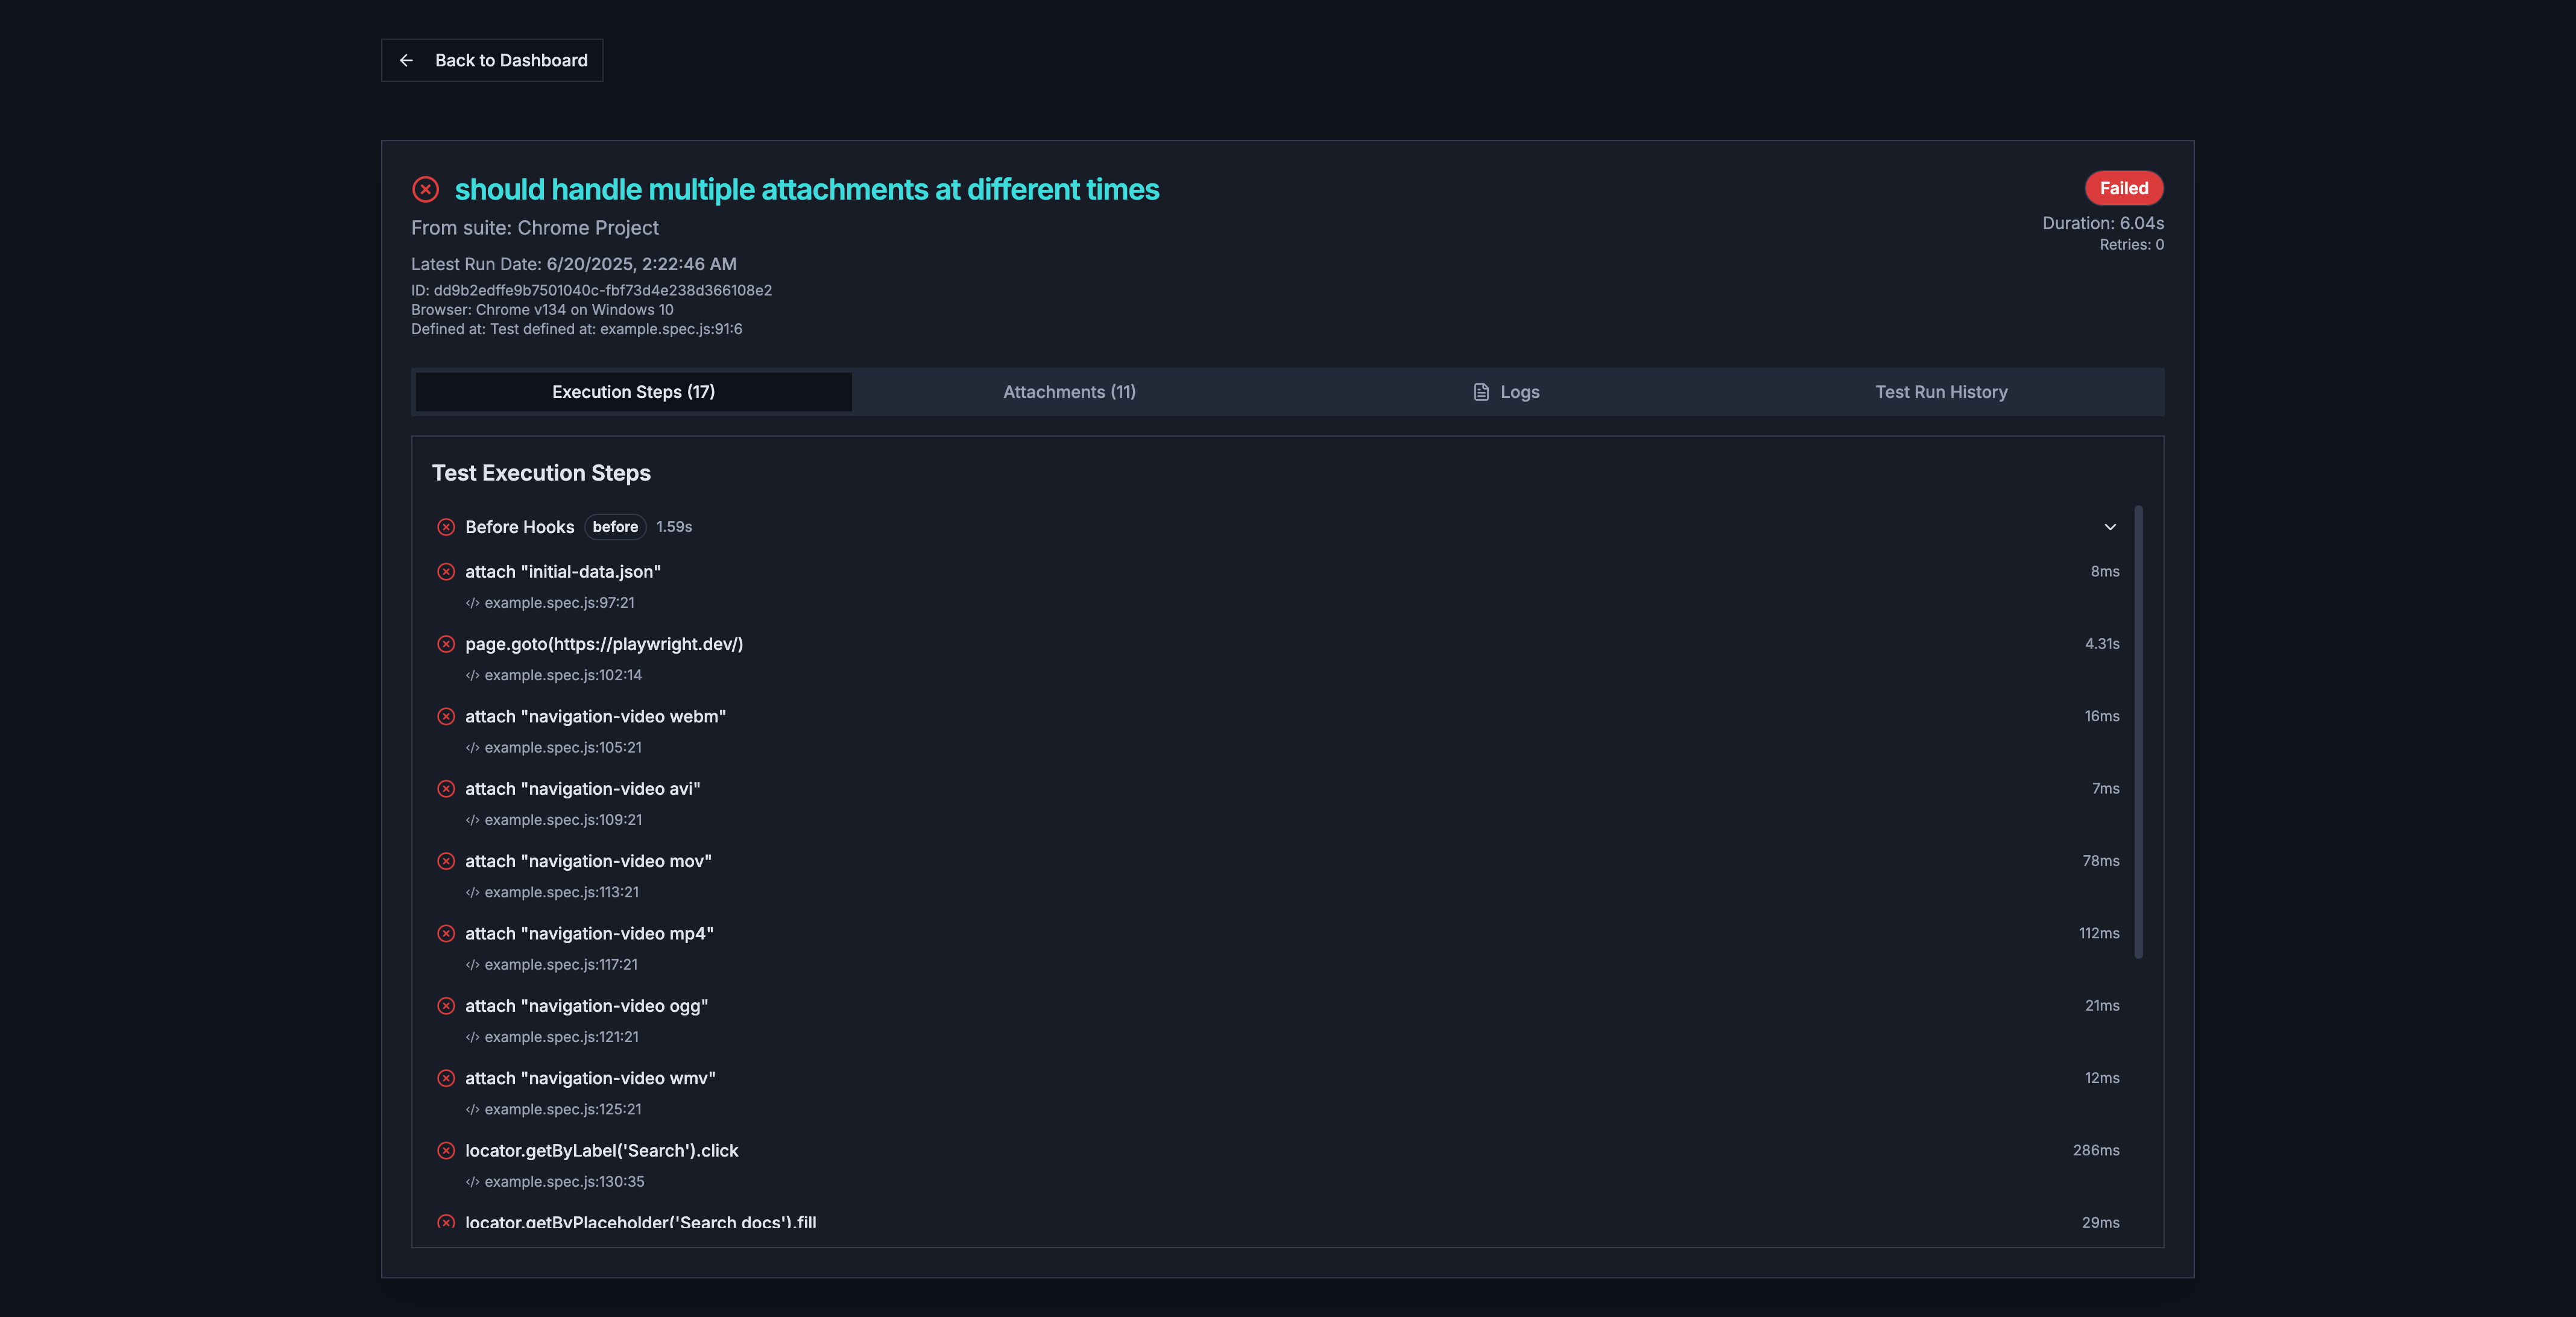
This page provides an in-depth, granular view of a single test execution. It is the primary tool for debugging a specific test failure. The page is organized into several expandable sections for optimal workflow.
A step-by-step log of every action performed during the test. Failed steps and error messages are highlighted in red for easy identification.
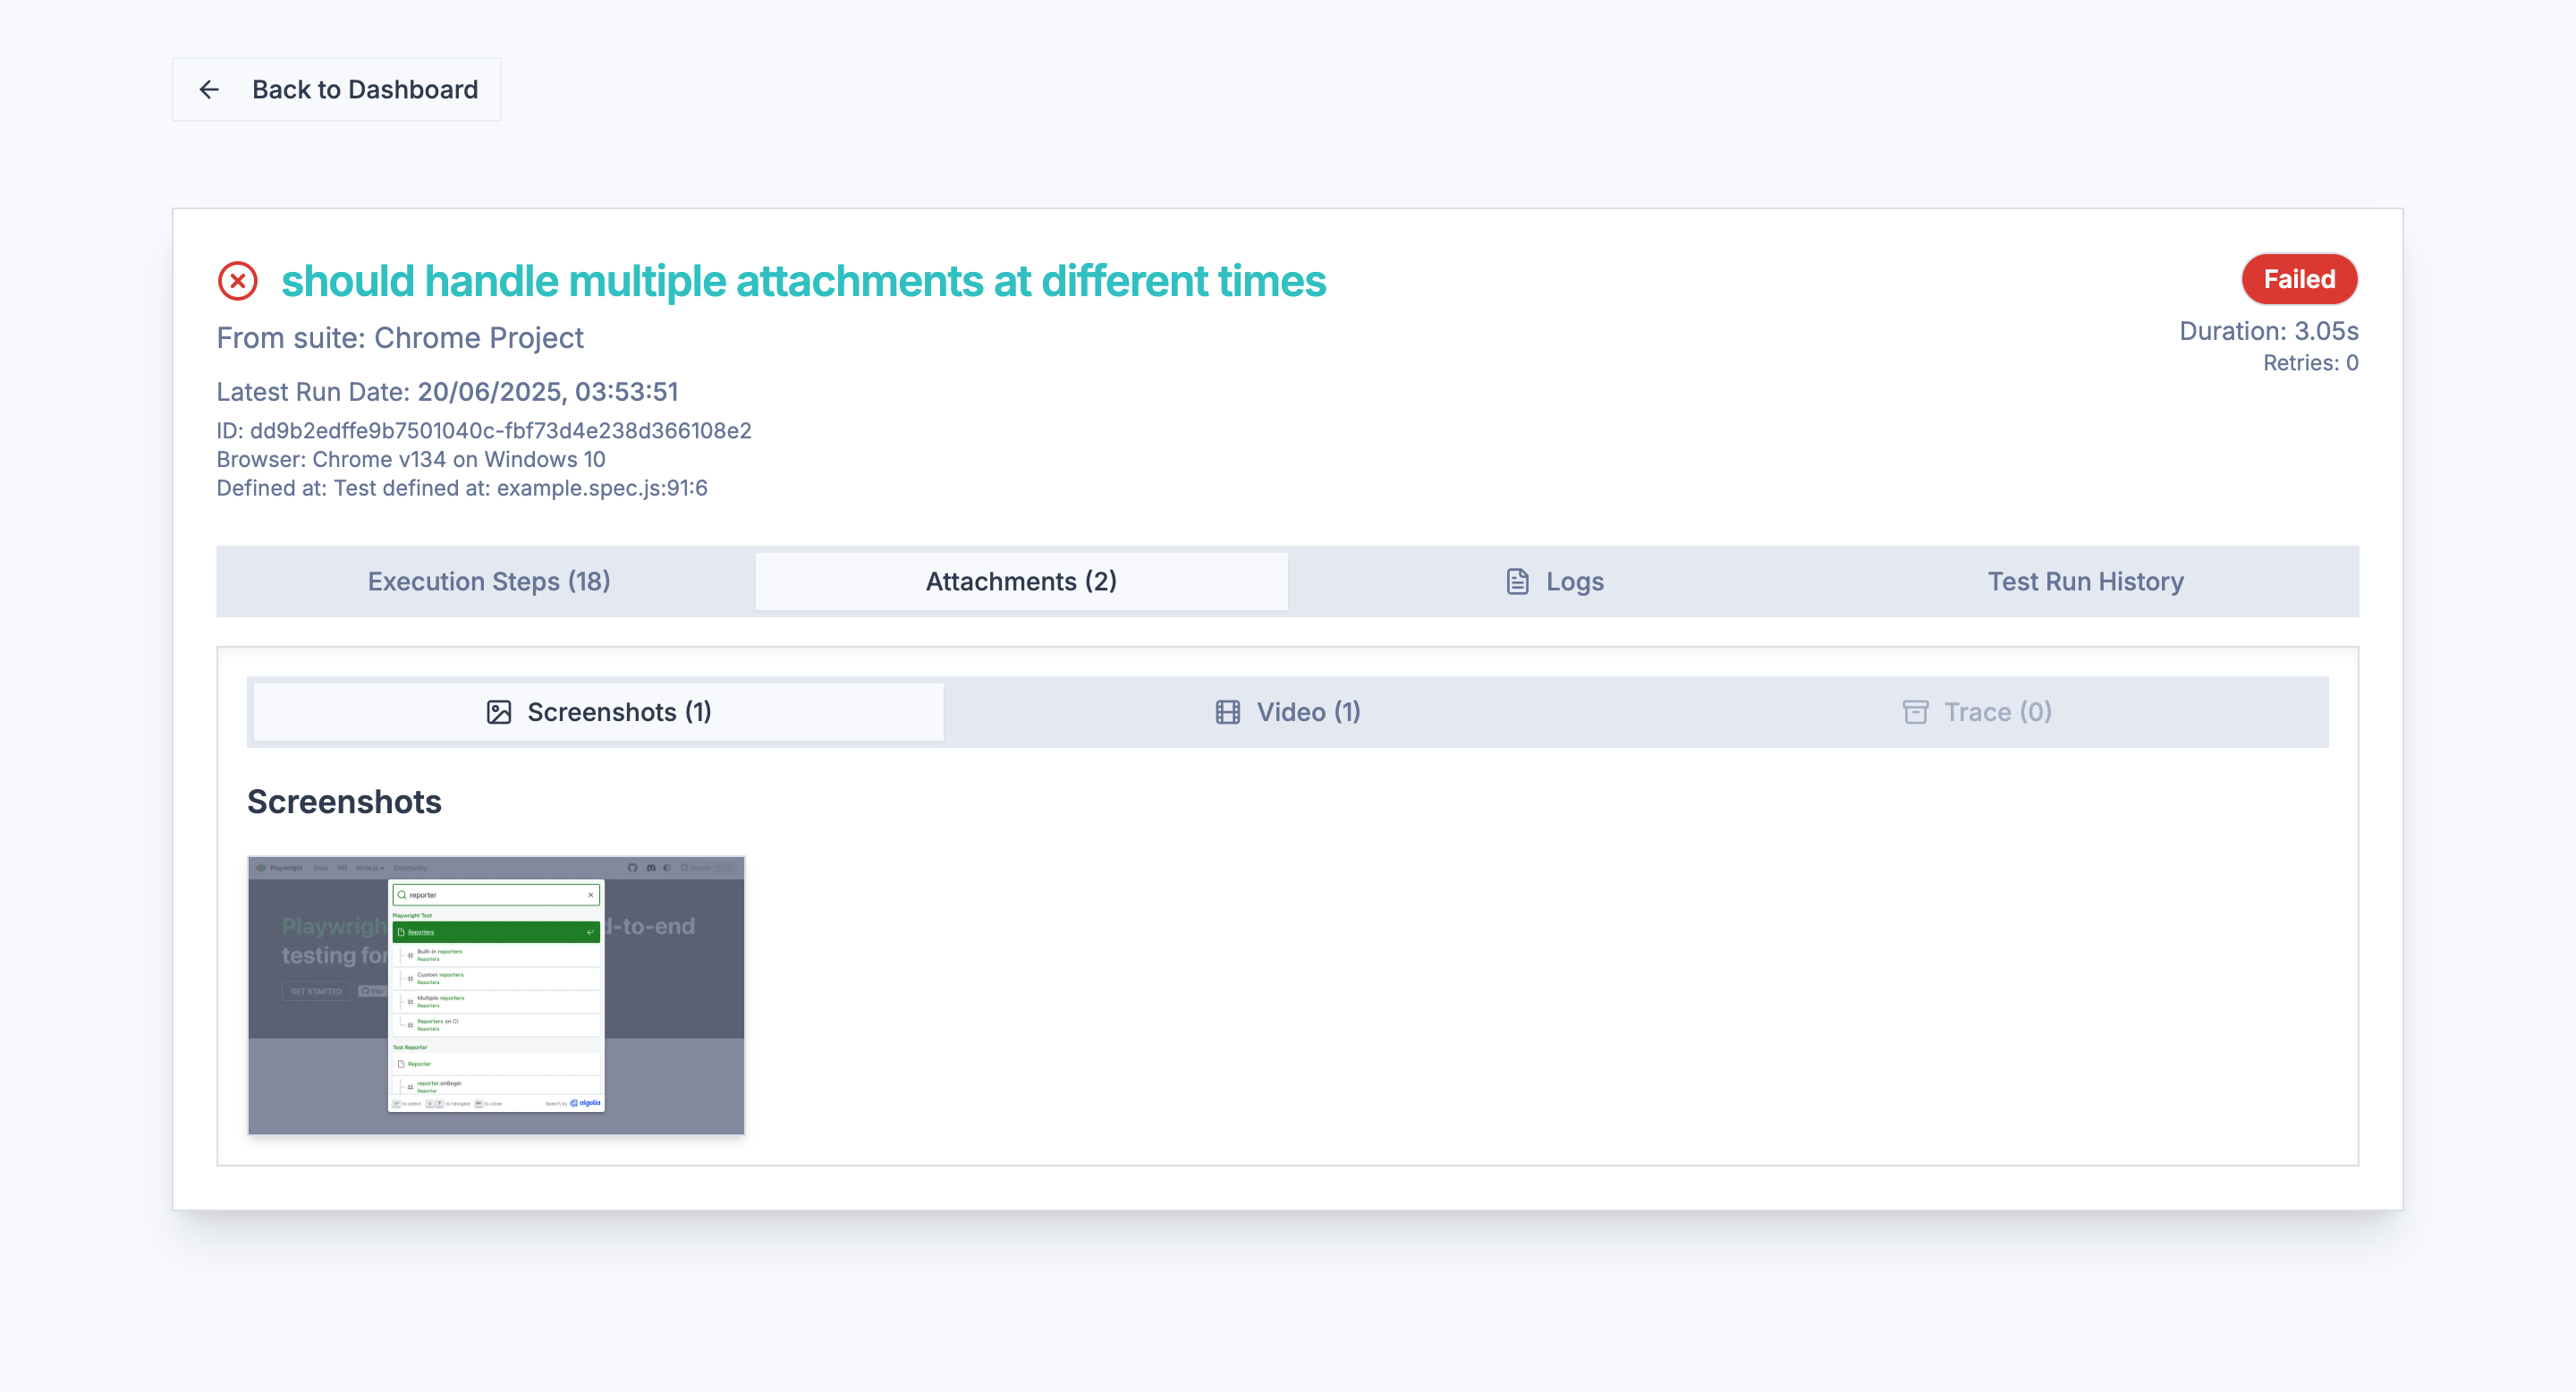
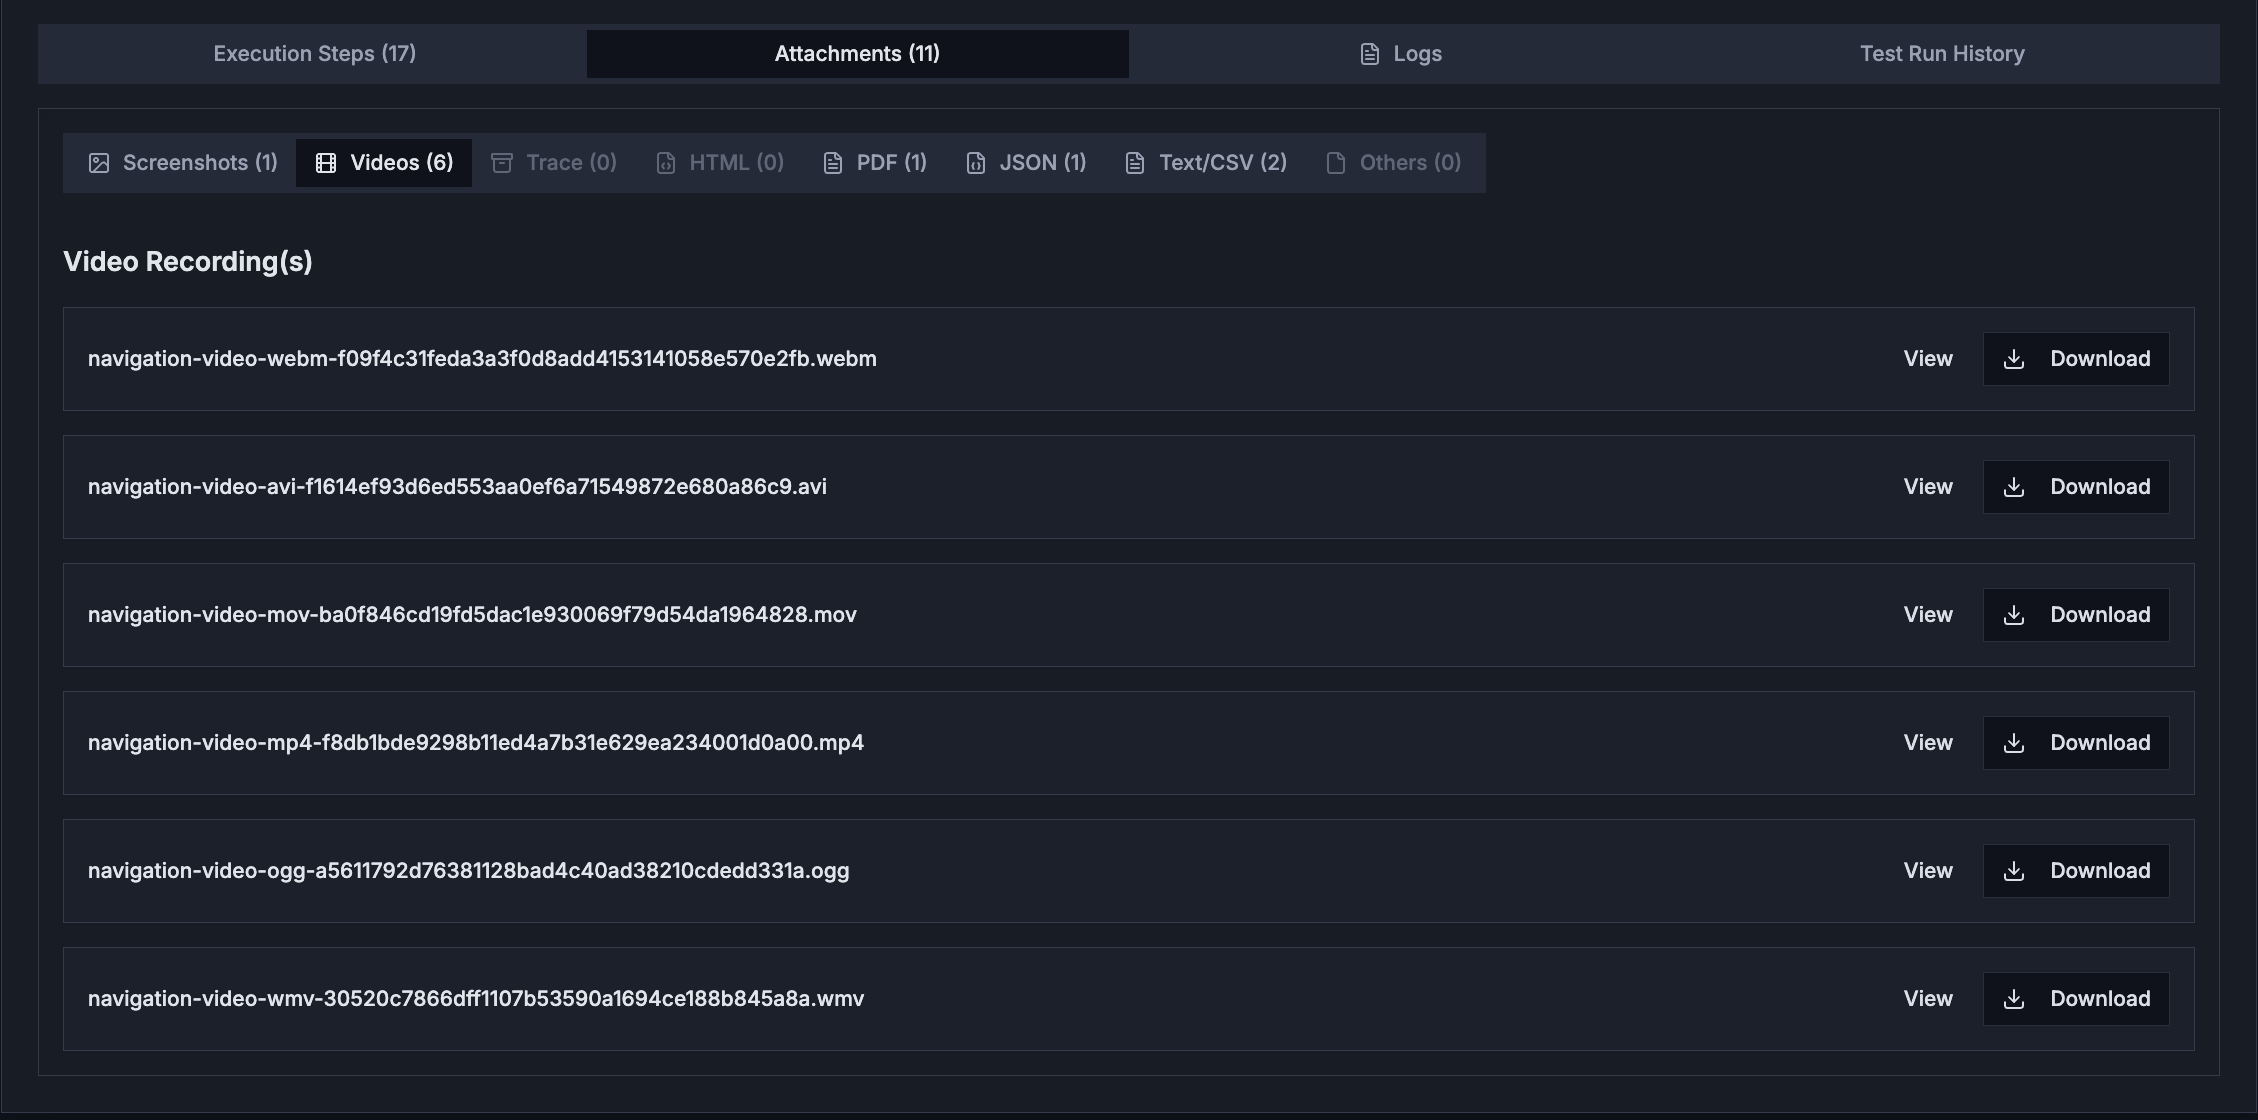
Access to all artifacts captured during the test run, such as
screenshots on failure, videos of the execution, and detailed
Playwright trace files for debugging. Also provides a visual
scope for test.info().attach()
files.
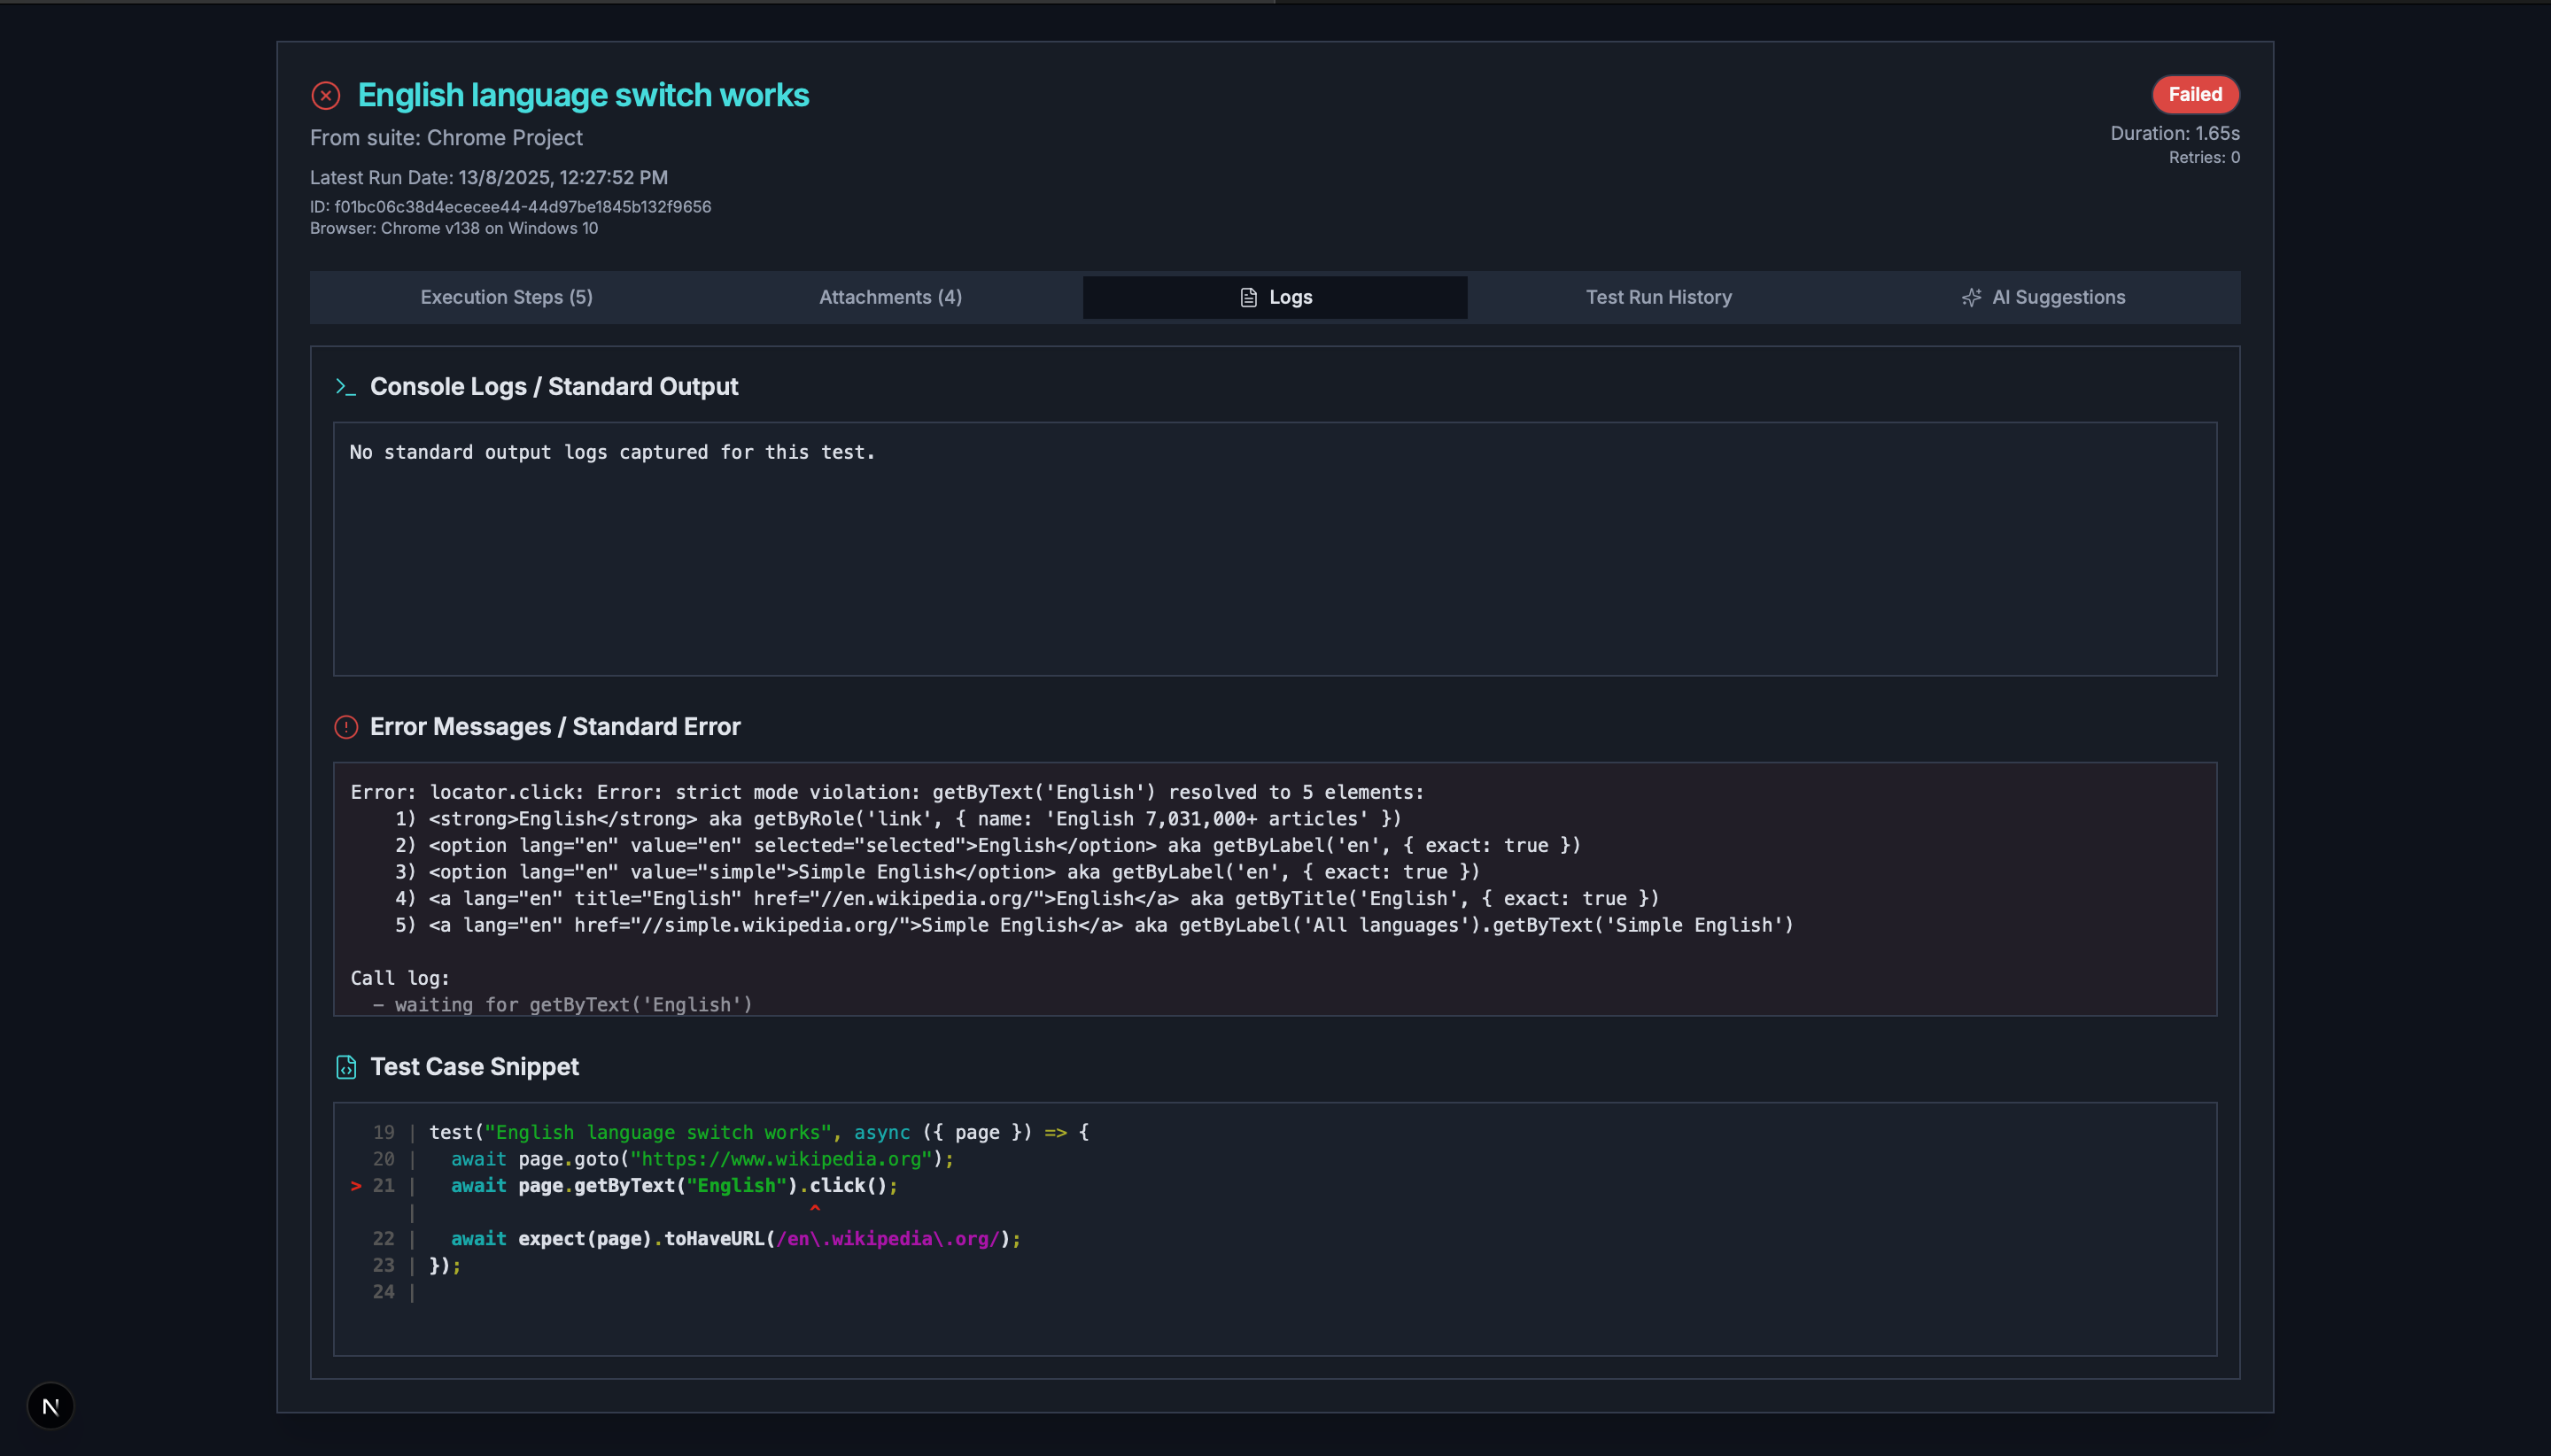
View any console output (from console.log
) and
standard error streams that were generated by the test or the
application during the run.
Also, for specific failed test cases, test case snippets are included in the logs for easy reference.
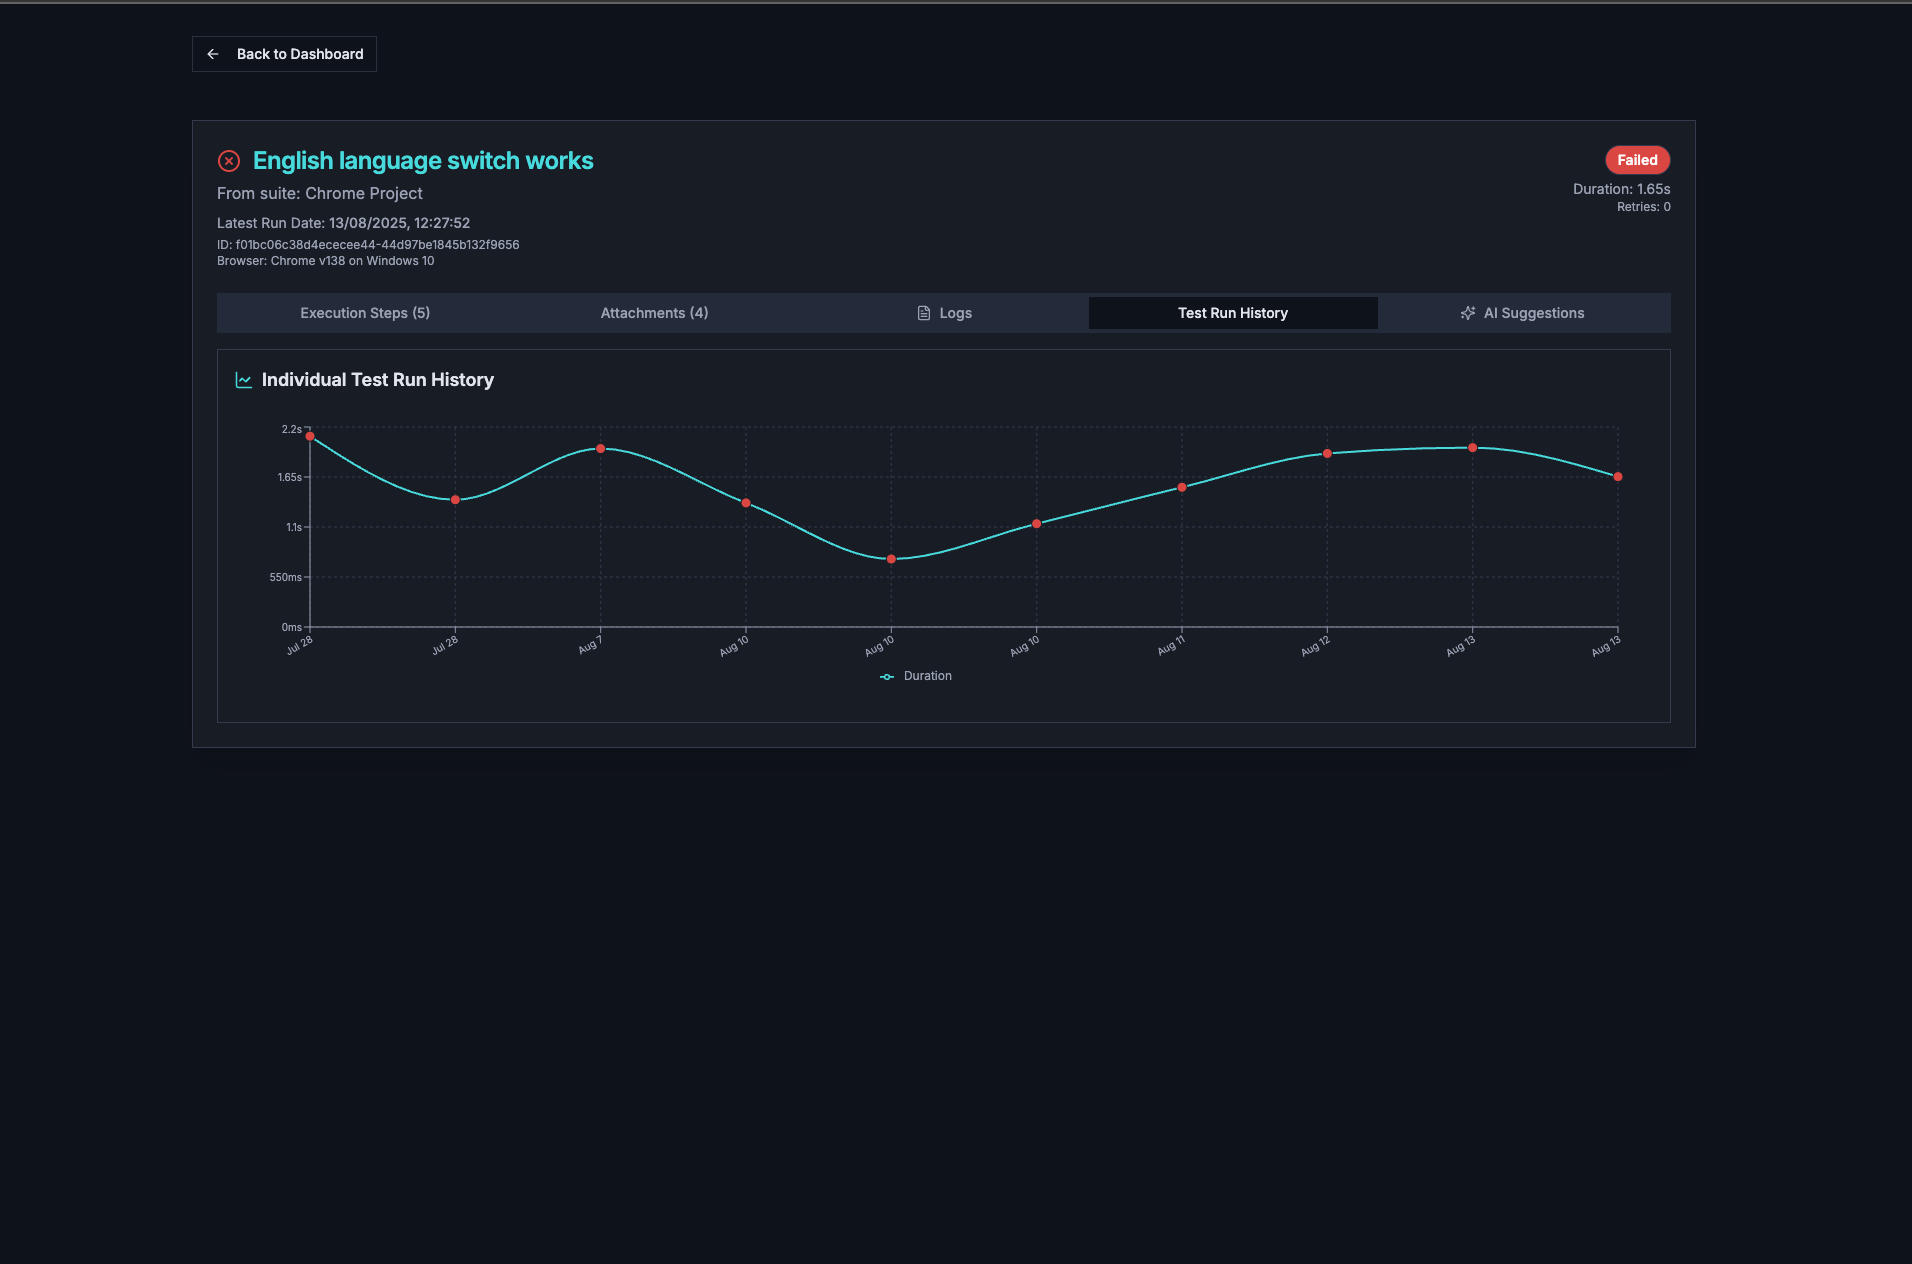
A historical view of this specific test's performance and status across previous runs. This helps identify if a failure is new, recurring, or intermittent (flaky).
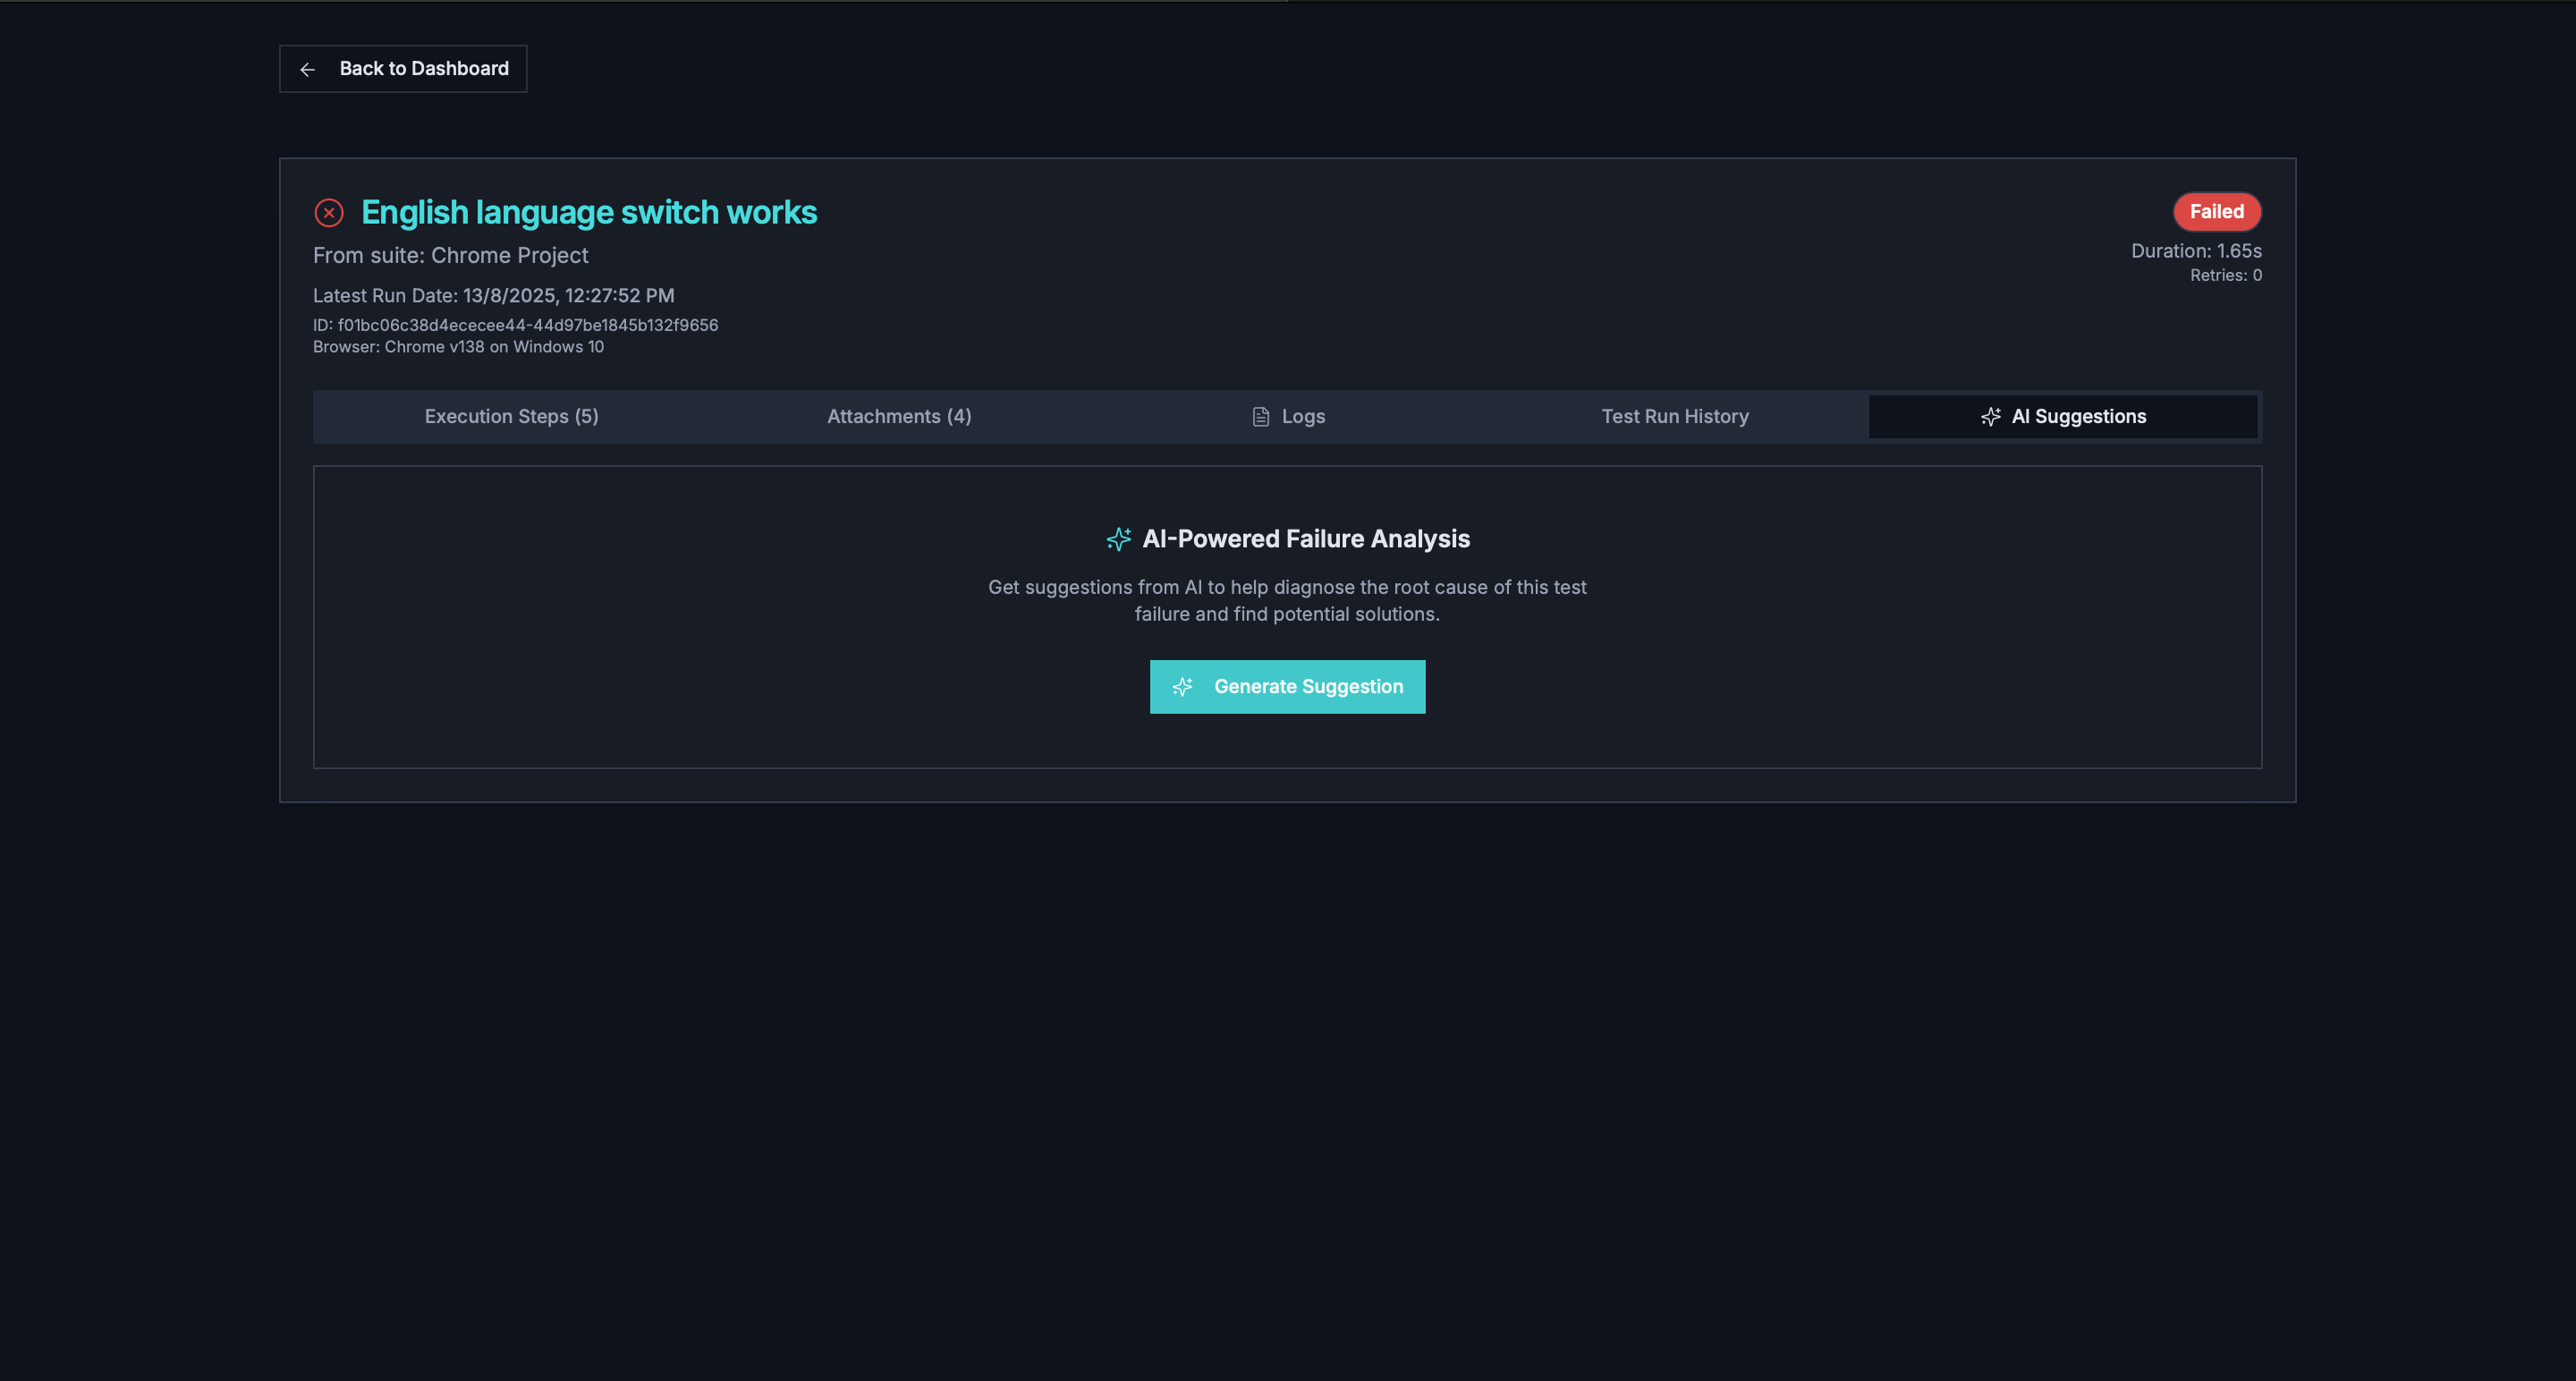
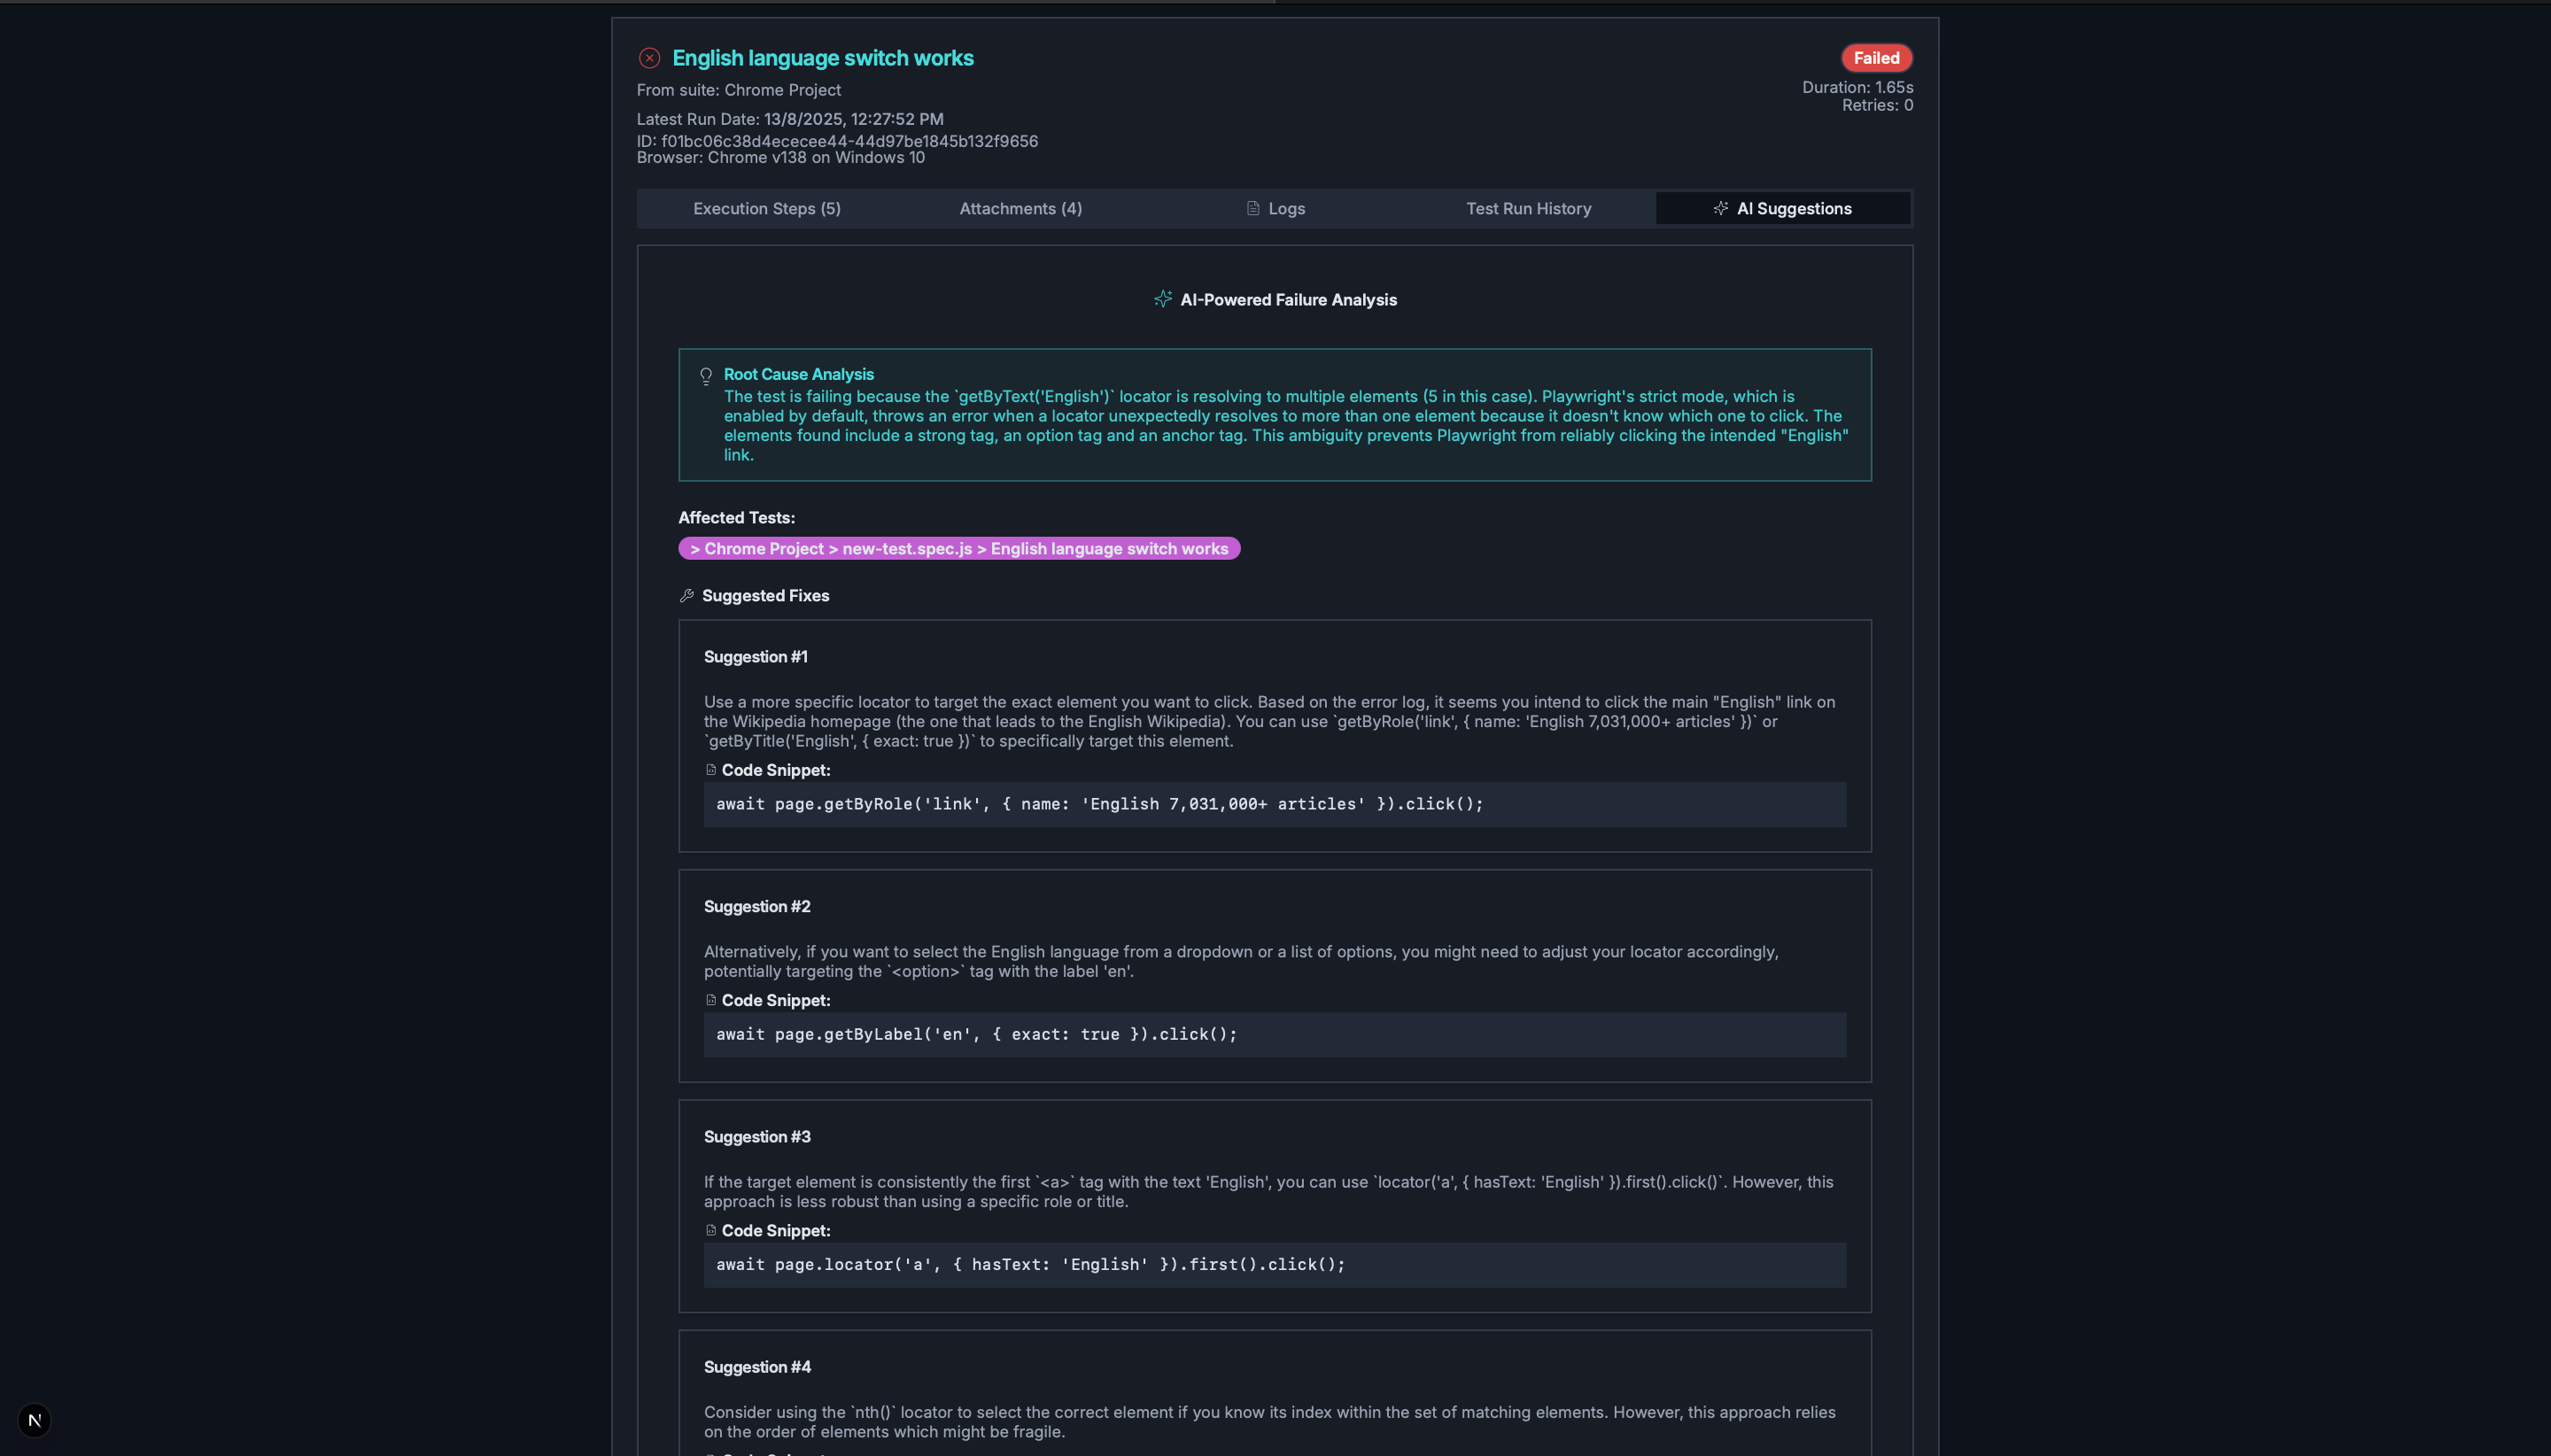
Get AI-powered suggestions for fixing failed tests. The AI analyzes test case names, snippets, and error logs to provide actionable insights for resolving issues quickly.
Note:
1. AI suggestions are based on the latest version of the test case.
2. AI Suggestion tab is visible for failed test cases only.
All notable changes to this project are documented here, starting with the most recent.
Test Details > Logs
.
README.md
to clarify how different attachment types
are sourced and displayed.
videoPath
.
workerCount
field added to the historical trend data
type.
useTestData
hook changed
from polling to a single fetch on load.
trends.map is not a function
error in
TrendAnalysis.tsx
.
flakinessRate
is passed correctly from
historical data.
ansiToHtml
to correctly render colored
console logs in the UI.
PULSE_USER_CWD
environment variable to
help locate the correct working directory.
useTestData
custom hook for data fetching.